Introduction
Version 7.2 of BI Smart Repository has just been deployed to production with a host of new features.
BO Audit - Report Baskets & Rationalization
New Feature – Report Basket Creation
Group a selection of reports into a basket to prepare your migration, optimization, or rationalization projects.
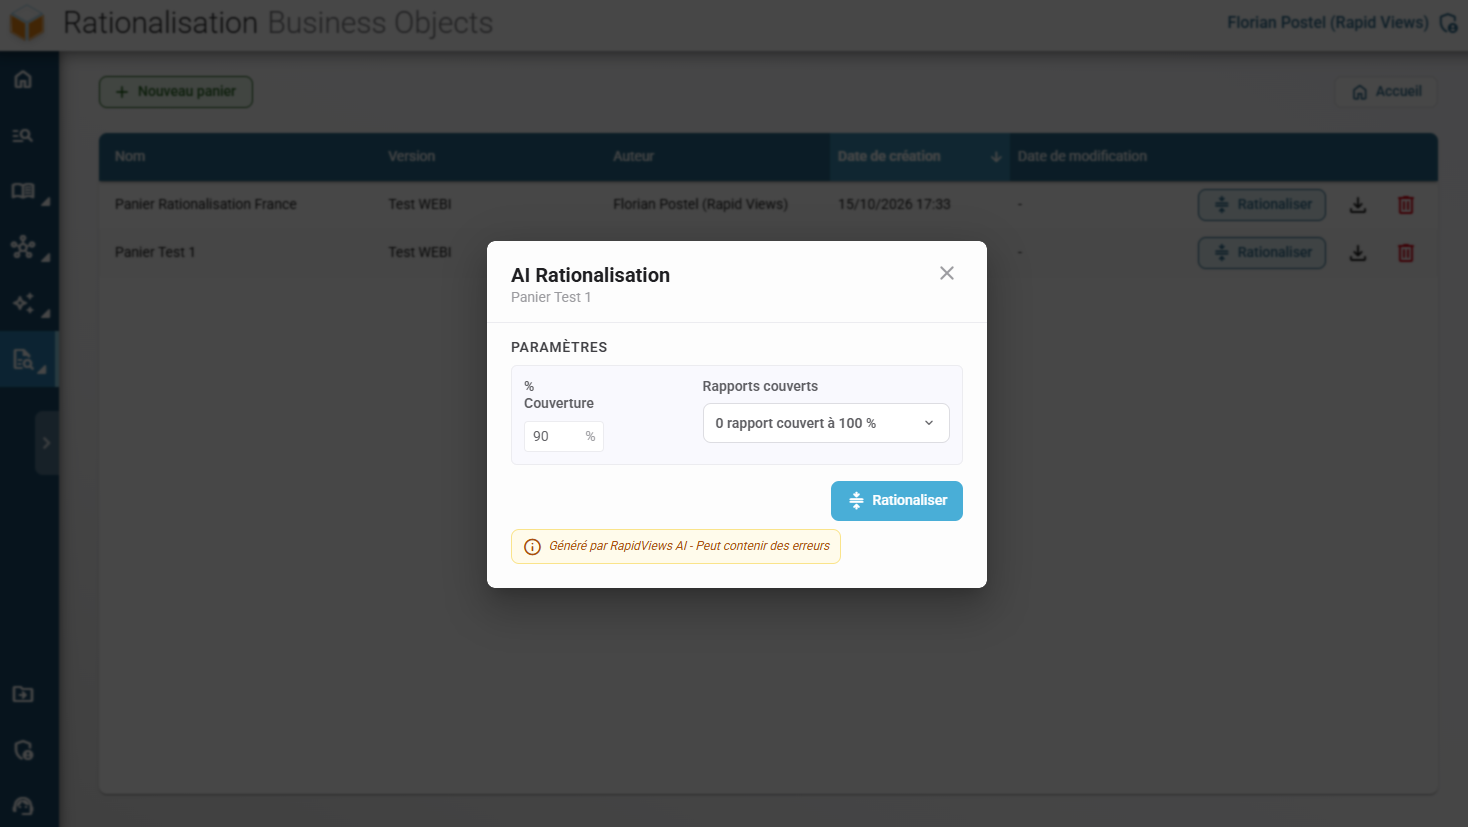
- Create baskets directly from the Audit global overview, with a customizable name (suggested default: "Basket {version_name}").
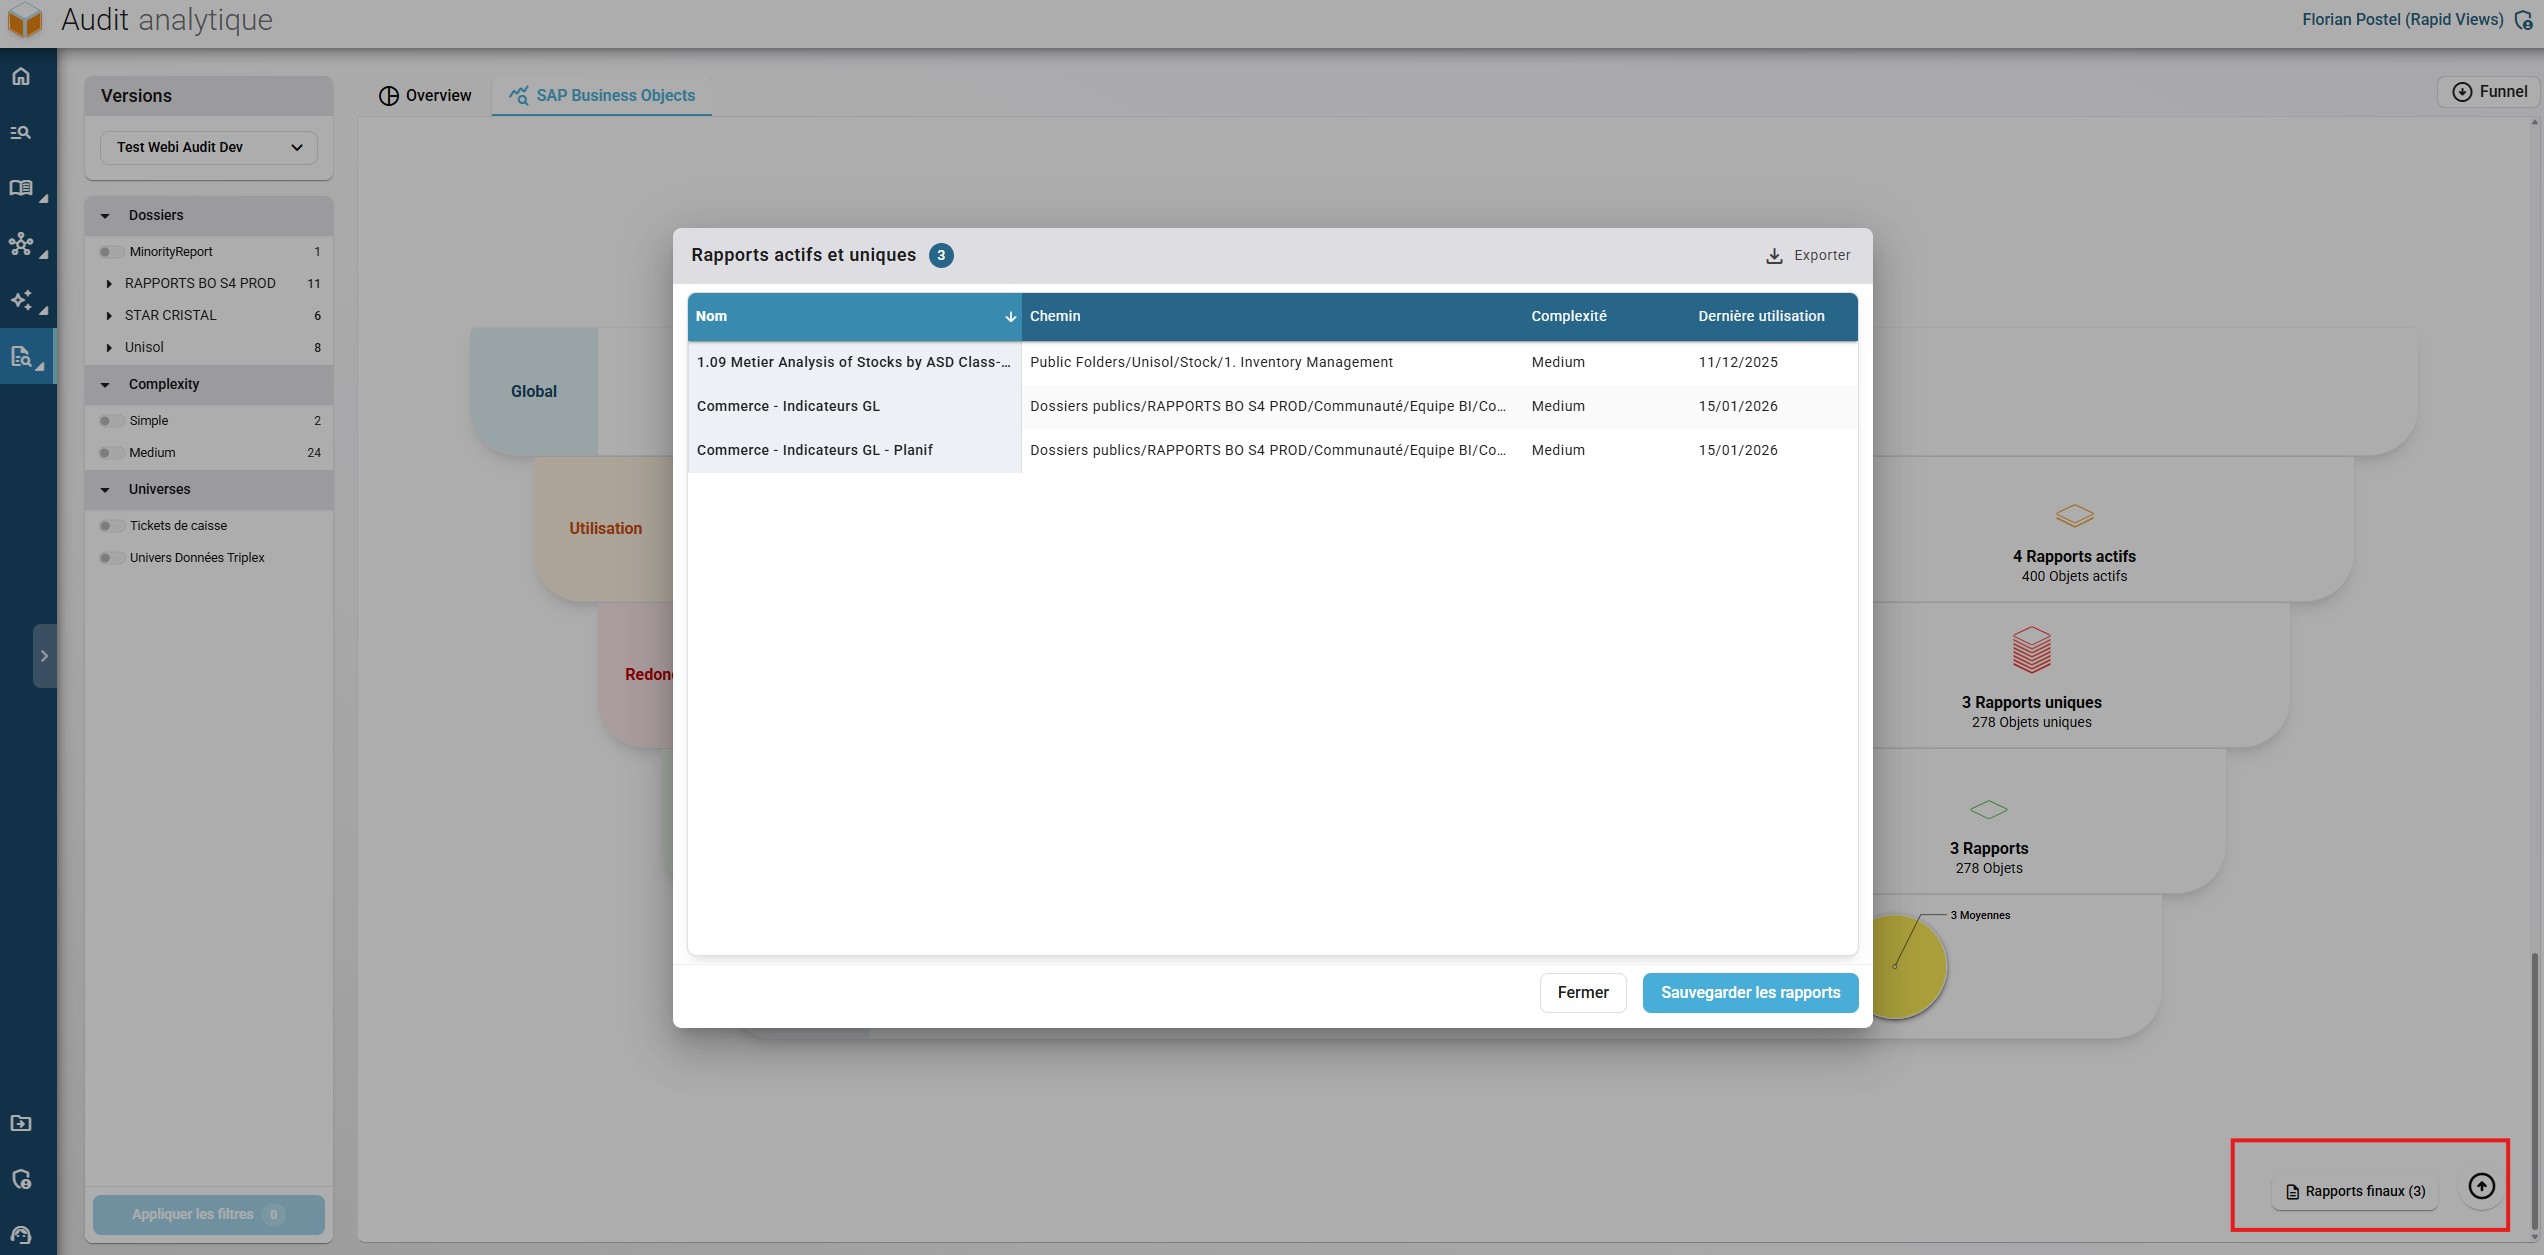
- Add or remove reports in the basket, or clear all contents in a single click.
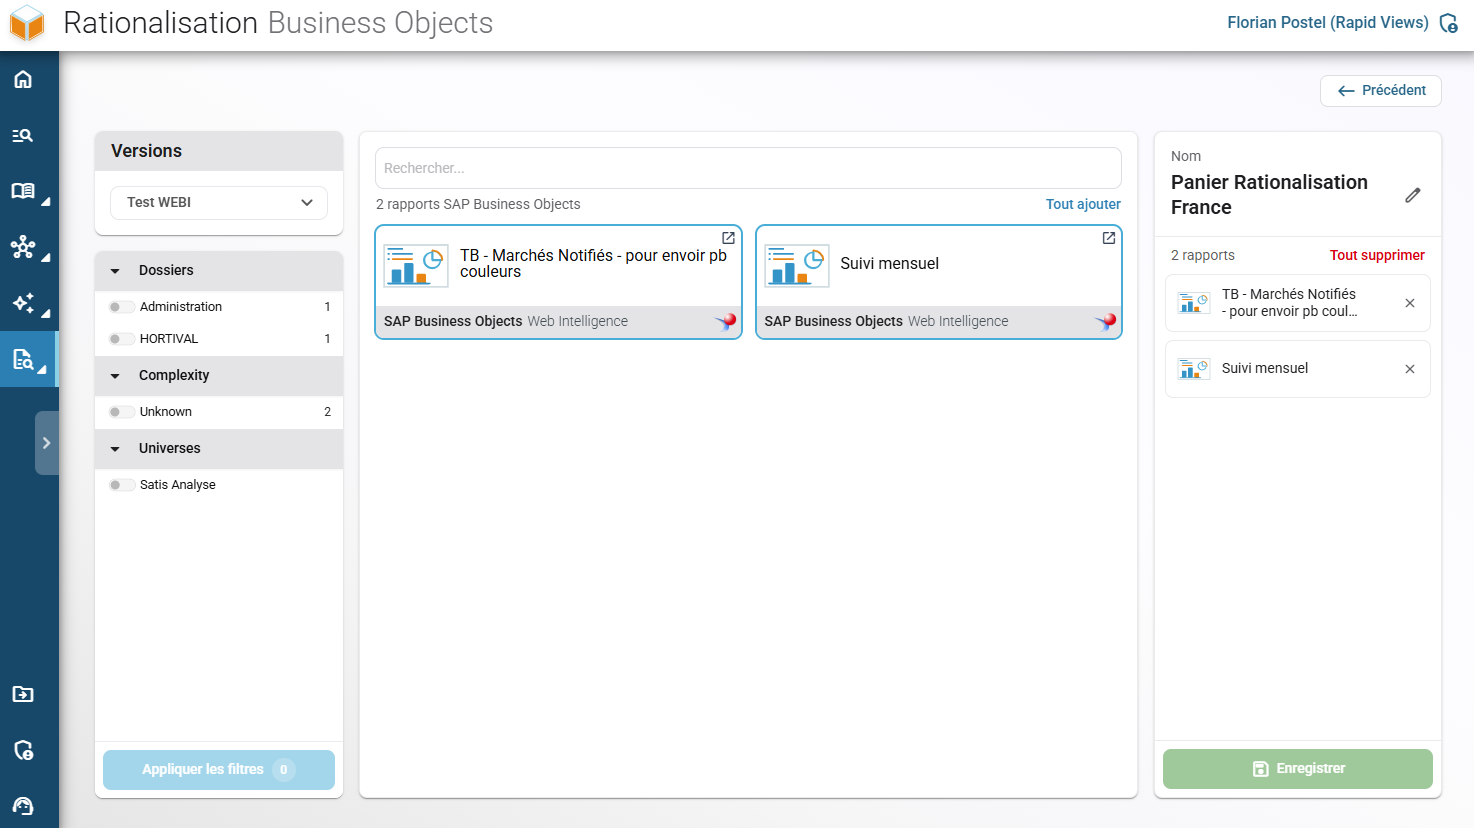
- Access the list of baskets with an Excel export of their contents (including report file paths and names).
New Feature - BO Rationalization
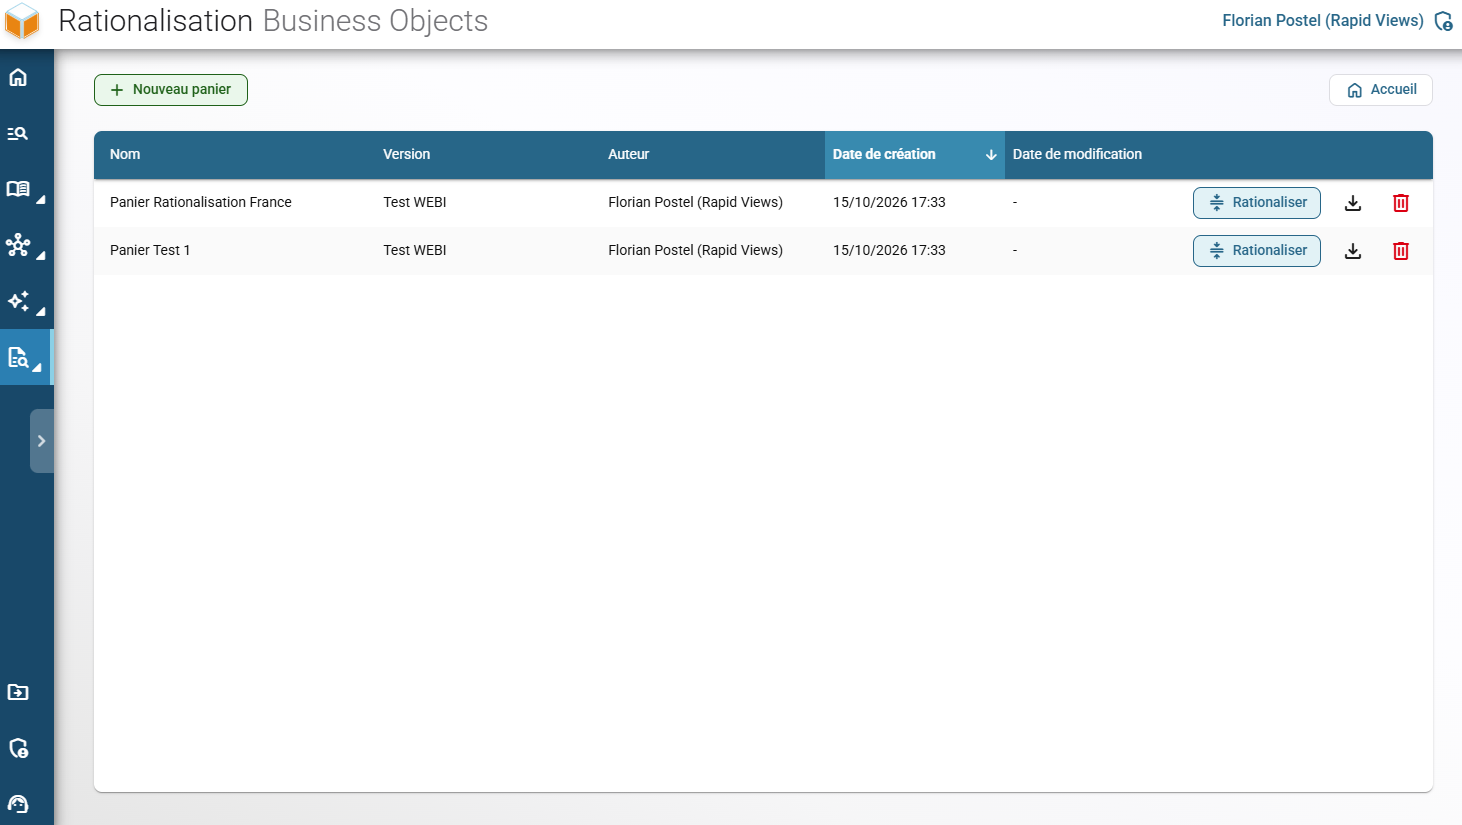
Launch a rationalization run directly from a basket: the platform identifies a minimal set of pivot reports capable of covering all objects used across the basket.
- Set the desired object coverage percentage.
- Select specific reports that must reach 100% mandatory coverage.
Results are provided via an automatically downloaded Excel workbook featuring:
- Final pivot reports along with coverage statistics.
- Uncovered objects, including the reports and tables in which they are used.
- The list of reports to rebuild, paired with their complexity ratings.
Dedicated UI screens displaying these rationalization results directly in the platform are currently in development and scheduled for release by year-end.
BO Audit - Enhancements
BO Schedules - Retrieval of Web Intelligence Report Schedules (Instances)
- Display of the last run date directly within the report audit view.
- Added scheduling details to Web Intelligence report metadata.
- Requires an extraction performed with the latest version of Minority Extractor.
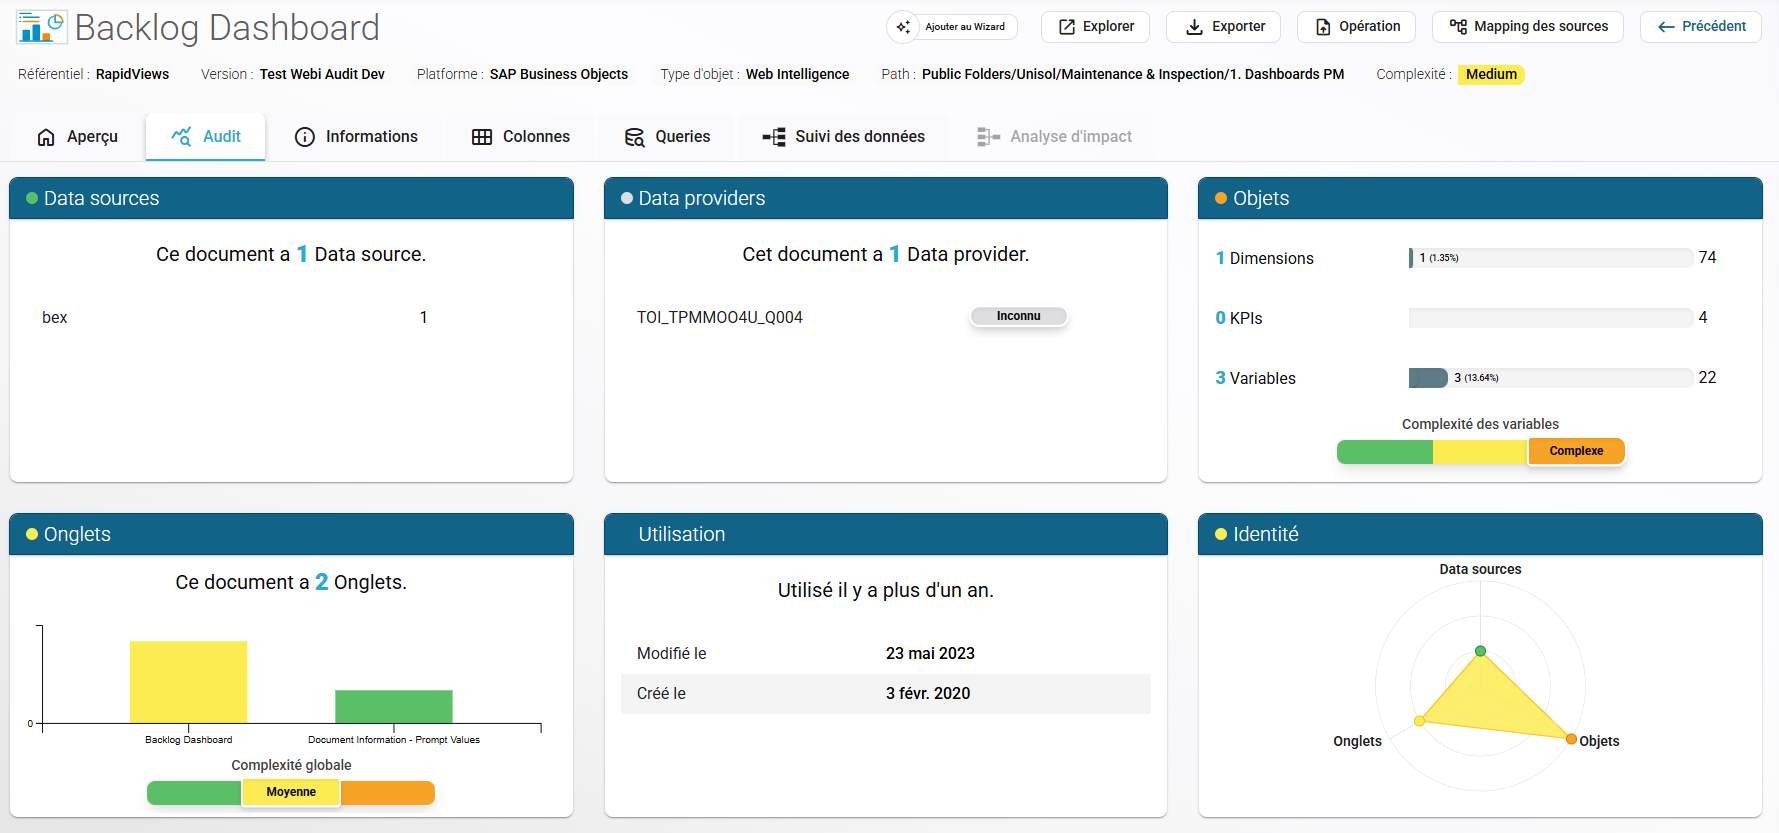
Complexity – The last usage date of a report is no longer factored into its complexity calculation
Report Audit - Updated Reading of the Usage Card
- The Usage card is no longer treated as a complexity criterion: the indicator and complexity level are no longer displayed in its header
- The report complexity radar chart now focuses strictly on sources, data providers, objects, and tabs
Complexity
Improved accuracy of block counts (tables, charts, etc.) across each Web Intelligence report tab, factored into the complexity calculation
Report Audit
The Identity card color theme now reflects the calculated complexity of the report
Filters
Alphabetical sorting of universes and folders
Counters
Fix for universe and Excel data source counters
Data Search – Advanced search, column-level search & object cards
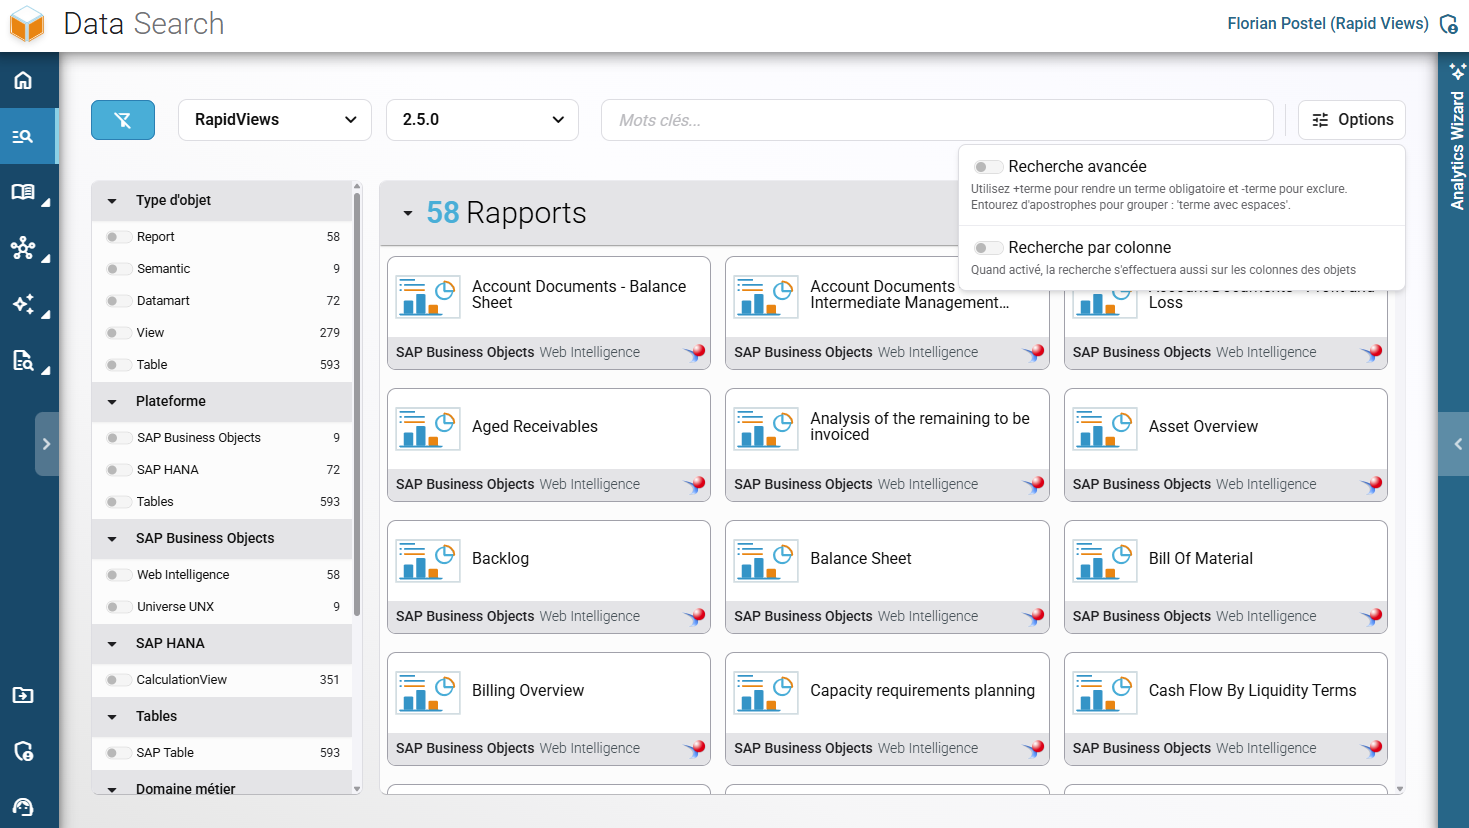
Column Search
New dedicated control allowing search queries to target object column names (both technical and business labels).
Advanced Search Redesign
Completely overhauled and accessible via a dedicated toggle button:
+term : makes a term mandatory.
-term : excludes a term.
'term with spaces' : searches for exact phrases.
Example: +batch -inspection 'stock level'
Web Intelligence Reports
– "Edited" vs. "Standard" Query Badges:
In the Queries tab, each query is now flagged as either manually modified ("Edited") or system-generated ("Standard").
Instantly identify customized queries requiring focused attention during migrations.
Requires an extraction performed with the latest Minority Extractor version (no badge is shown for legacy extractions).
Datamart
Added routines display under the Columns tab for Datamart objects (cubes).
Excel Export – Column-level lineage
New "Column Lineage" tab: added to the object-level Excel export
For each column, this sheet tracks its complete upstream ancestry step by step: level N column, followed by object type, name, and level N-1, N-2 columns, and beyond.
Background generation & email delivery
- Due to the comprehensive depth of this export, processing is handled asynchronously in the background, and the workbook is delivered directly via email.
- A confirmation modal alerts users that generation may take a few minutes.
Data Lineage – Large Lineage Management
Lineages containing massive object volumes now benefit from dedicated handling to preserve interface responsiveness and clarity. This behavior applies equally to Data Lineage views and Impact Analysis.
Between 1,000 and 5,000 Objects - Automatic Folding of Repeated Segments
- Repeated lineage paths are collapsed by default.
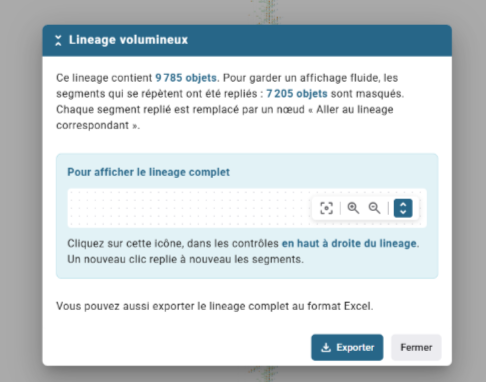
- A "Large Lineage" notification highlights total object counts, indicates the number of hidden nodes, and explains how to display or export the full graph (with a "Do not show again" toggle).
- Each collapsed path is represented by a "Go to matching lineage" card displaying the number of hidden nodes.
- Hovering over this card highlights the related path; clicking automatically pans and zooms the canvas to that segment.
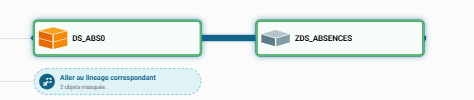
- A toggle control in the top-right toolset enables expanding or collapsing all repeated segments simultaneously.
Beyond 5,000 objects - Performance safeguard
- Visual graph rendering is disabled to preserve browser stability. A "Lineage Too Large" warning indicates the object count and threshold limits.
- The prompt directs users to export the object to Excel (via the "Column Lineage" tab) to review complete upstream and downstream traces. For objects without direct export options, export can be initiated from the parent asset.
General lineage performance & reliability
- Smoother navigation, zoom, and hover interactions across dense lineage graphs.
- Visual animations and effects are automatically disabled once graphs exceed 300 visible nodes.
Explicit notification modal introduced when a lineage cannot be rendered.
Connectors – Enhancements
SAP BW - Open ODS Views:
Open ODS Views are now extracted (HANA and ABAP) and fully integrated into lineage graphs.
SAP BW - Metadata Enrichment
Improved labels, columns, and descriptions across InfoSets, InfoSources, InfoCubes,DSOs, and BEx Queries.
SAP BW - Object Typing
Resolved an issue where InfoSets were miscategorized as InfoObjects.
SAP BO / Web Intelligence - UNX Universes on SAP BW (DSO):
Objects within UNX universes built over BW DSOs are now mapped directly to their underlying BW sources, enabling end-to-end column lineage from Web Intelligence reports down to BW data layers.
SAP BO / Web Intelligence - Excel Data Providers
Columns from Excel spreadsheets used as Data Providers are now parsed: a source table object is generated and linked to the corresponding report assets.
SAP BO / Web Intelligence - Deduplication
Universes referenced twice in a single import manifest are no longer duplicated.
Power BI - SQL Expressions
Power Query SQL statements can now be directly linked to database views.
Power BI - PBIR Format Support
Native support for the enhanced report format (PBIR) introduced in recent Power BI Desktop updates. Visuals, pages, fields, and measures are mapped and wired to source tables. Legacy formats remain fully supported.
SAP Datasphere
Corrected source mapping for Replication Flows and implemented source filter ingestion.
General improvements
Framework Upgrade
Migrated core front-end architecture to Angular 21, improving platform responsiveness, rendering speeds, and long-term maintainability.
Operations
Fixed the imported vs. non-imported object filter within import summary screens.
Minority Extractor
SAP BW: Added extraction support for Open ODS Views (HANA and ABAP).
SAP BW: Scheduled automated extractions are now supported for SAP BW instances.
SAP BW / ABAP: More explicit error logging during extraction routines.
SAP BW / ABAP: Removed legacy alternative function module calls that triggered authorization failures (SU53).
SAP BW: Enriched metadata ingestion (labels, columns, descriptions) for InfoSets, InfoSources, InfoCubes, DSOs, and BEx Queries.
SAP HANA: Added extraction support for HANA tables located outside standard SAP schemas.
SAP BO – Global Folder Search:
New option to search for reports across the entire BO folder hierarchy (including nested subfolders), displaying full paths for quick identification.
SAP BO: Retrieval of Web Intelligence scheduling metadata and instances.
SAP BO / Web Intelligence: Ingestion of source names for Excel Data Providers.
SAP BO / Web Intelligence: Ingestion of the "Edited" vs. "Standard" status for report queries.
SAP BO / Web Intelligence: Accurate reporting of block counts (tables, charts) per tab.
SAP BO: Fixed redundant universe exports when a universe was both directly selected and referenced as a source in an exported report.
SAP BO: Improved extraction accuracy for UNX connection types.
SAP BO: Resolved authentication exceptions (HTTP 401) on BO 4.1 environments.
SAP BO / Audit: Configurable audit history depth (full history or 1 to 10 years) alongside connection test optimizations.
Qlik Cloud - Connector Fixes
- Restored connection validation and app catalog retrieval following Qlik Cloud API breaking changes.
- Full tenant coverage: app listing now pages through the entire tenant inventory beyond the initial limit.
- Enhanced API error handling (invalid/expired tokens, insufficient tenant roles, host unavailability).
- Addressed extraction crashes occurring on applications utilizing master dimensions.
Let's talk about your project
Would you like to take things further after reading this article? Book a 30-minute call with a RapidViews expert to discuss your SAP challenges and optimize your infrastructure.
Book an appointmentFrequently asked questions
What is the purpose of the new Report Baskets in BO Audit?
Report baskets allow you to group specific SAP BusinessObjects reports to streamline migration, cleanup, or rationalization workflows, complete with full Excel export capabilities.
How does the BO Rationalization feature work?
Launched directly from a basket, the platform identifies a minimal set of pivot reports that cover the objects used across the selection. You can set a target coverage percentage and designate specific mandatory reports that must be retained at 100%.
What changed in the report complexity calculation?
The last execution date has been removed from the complexity formula. The score and its radar view now focus purely on structural complexity: data sources, data providers, variables/objects, tabs, and an improved block-counting mechanism.
How does the platform handle massive data lineages over 1,000 or 5,000 objects?
For graphs containing between 1,000 and 5,000 objects, repeated segments are collapsed by default to maintain readability and performance. For graphs exceeding 5,000 objects, visual rendering is safely disabled, prompting an asynchronous Excel export to trace all dependencies seamlessly.