Analytical Audit of your Web Intelligence Reports
A brand-new feature of BI Smart Repository marks a key milestone in our software’s evolution: the Web Intelligence Report Audit. Designed to provide enhanced and actionable visibility into your report assets, this innovation addresses major challenges in performance, rationalization, and the management of your decision-making environments.
Faced with the proliferation of reports and increasingly complex usage patterns, it is becoming essential to have tools capable of analyzing, structuring, and extracting value from this information. This is precisely the goal of the Audit feature, which is divided into two complementary parts.
On one hand, a Global Audit provides a consolidated view of all your reports: usage, consultation frequency, redundancy detection, and an estimation of potential ROI for migration or optimization projects. On the other hand, a Detailed Audit offers an in-depth analysis of a specific report, exploring its data sources, data providers, objects, visuals, and overall structure, while assessing its complexity level.
With this new feature, you now have a powerful lever to better understand, control, and optimize your reporting environment.
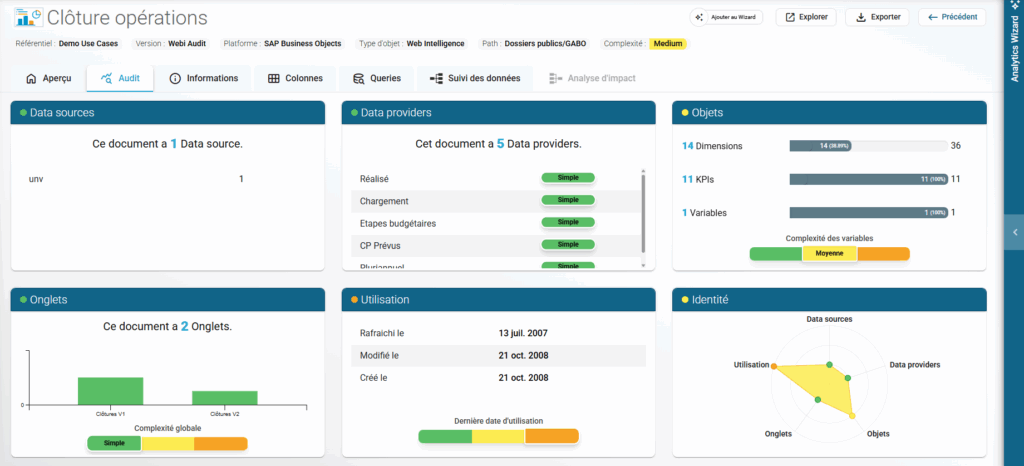
Web Intelligence Report Audit
Inside BI Smart Repository, you will find the new “Audit” tab. It serves as an identity card for a Web Intelligence report imported into the platform, consisting of five sections:
The list and type of Data Sources.
The list of Data Providers, query names, and their complexity.
Document Objects, indicating whether they are Dimensions, KPIs, or Variables, and their specific usage within the report.
The list of Tabs, including their names and the number of visuals per tab.
Report Usage, including creation, modification, and refresh dates.
Finally, a summary section provides visibility into the overall report complexity based on these five elements.
Repository Audit
In the left-hand menu of your BI Smart Repository, you will find the “Analytical Audit” feature. The goal of this tool is to provide a global overview of a Web Intelligence repository and all imported reports.
This global view can be filtered by several criteria:
Report Folders from the SAP BO platform.
Source Universes of the reports.
Business Domains configured in the Business Catalog.
Global Vision
The first section offers six key insights:
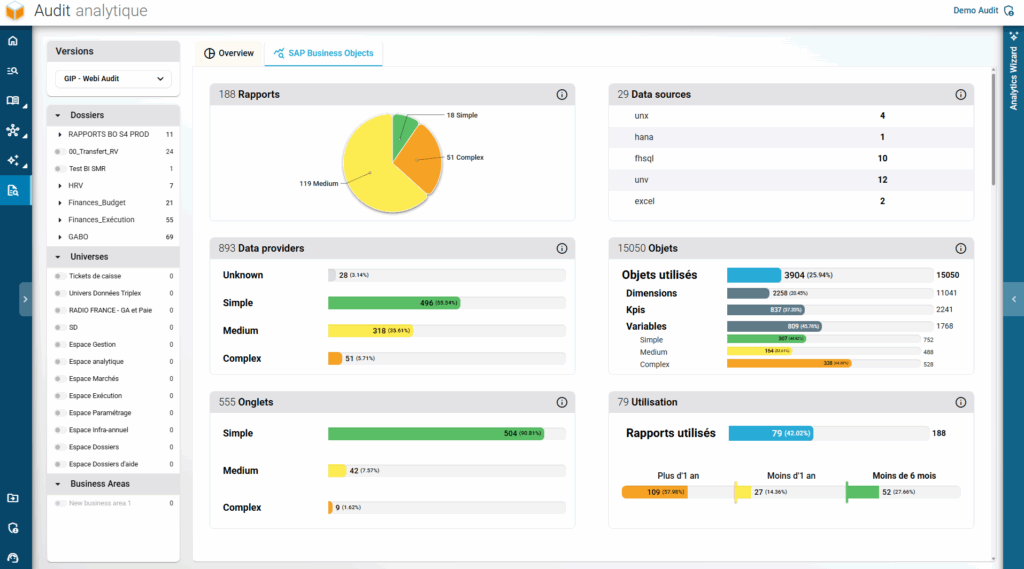
- Report distribution by complexity: This is calculated for each report as described in the previous chapter.
- List of all Data Sources used by the documents and their types.
- Distribution of Data Providers by complexity: Note that an “Unknown” status may appear for Data Providers without queries.
- Total Object Counter: Breakdown by Dimensions/KPIs and their usage. A distinct counter for Variables assesses their complexity and utilization.
- Total Tab Counter for reports, including their complexities.
- Report Usage distribution across three timeframes:
Used within the last 6 months.
Used between 6 months and 1 year ago.
Not used for over a year.
Note: The date used is the most recent among creation, modification, opening, or refresh dates (provided the audit database connection was active during export).
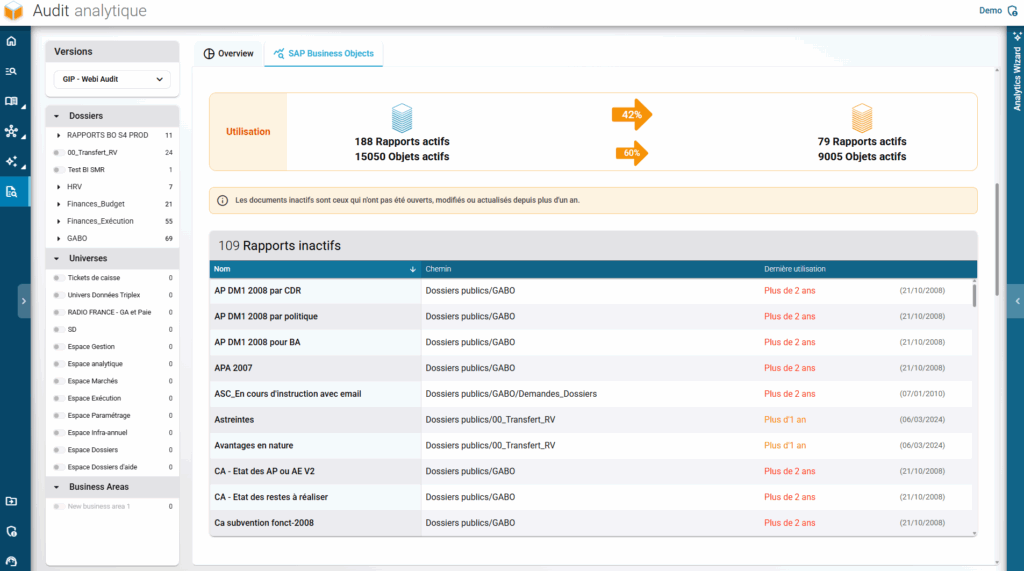
Usage
The second part details the utilization of these reports, specifically listing all those that have not been used for more than a year.
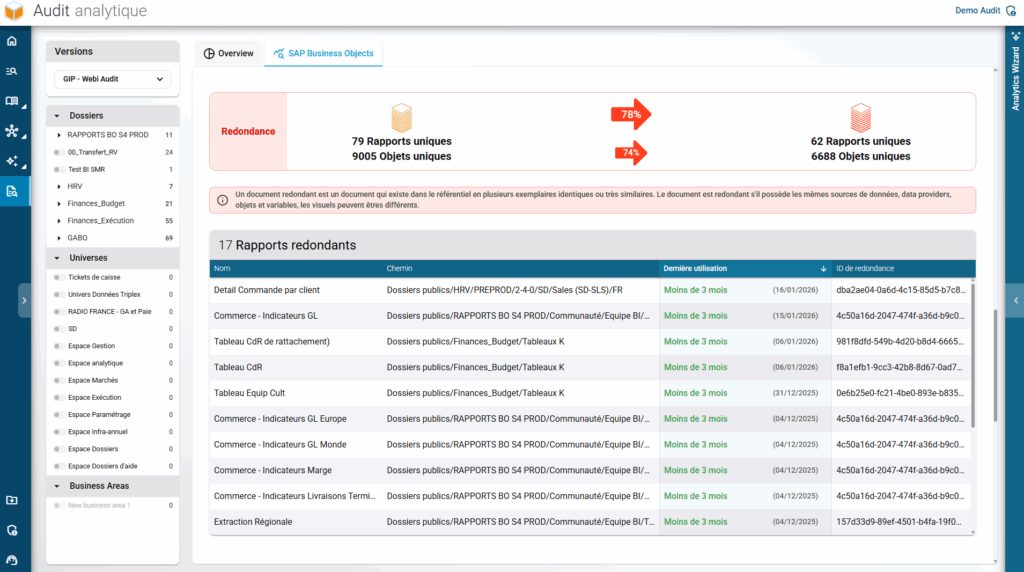
Redundancy
The third part highlights redundancy between reports, listing those that can be “assimilated into an existing report.” A unique identifier allows for quick visualization and grouping of similar reports.
Important: Two reports are considered redundant if they share the same data sources, data providers, objects, and variables. However, the visuals themselves may differ.
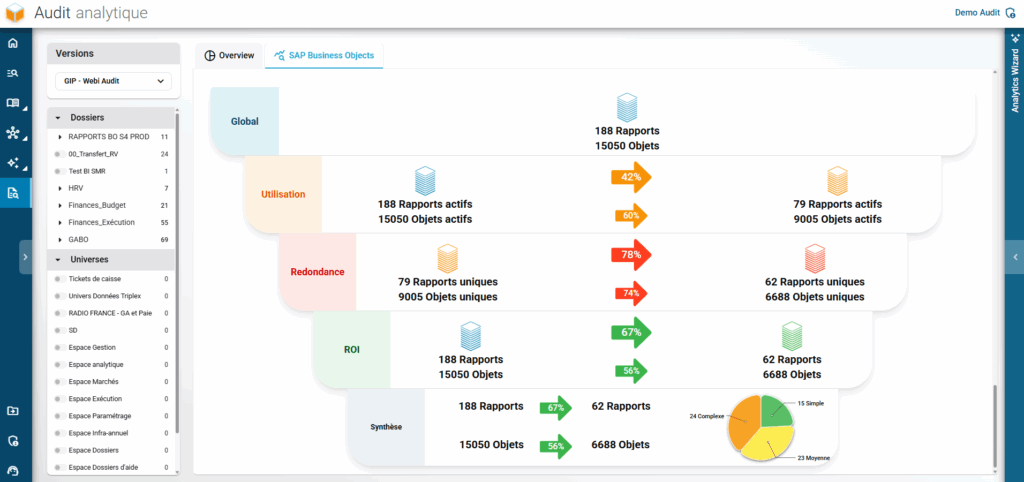
Funnel
The Funnel offers a synthetic view of all analyses presented in the previous sections. It highlights strategic KPIs, which are particularly relevant for BusinessObjects server rationalization projects or migrations to new BI platforms.
The Funnel concludes with a global synthesis and an estimation of potential ROI — calculated at both the report and object levels. Our platform allows you to quickly identify achievable gains on your SAP BusinessObjects environments.
Conclusion
In conclusion, this Audit feature was designed to provide a better understanding and a structured reading of your Web Intelligence reports. By combining global vision with detailed analysis, it helps you easily identify usage patterns, dependencies, and complexity levels. It serves as a concrete foundation to objectify your analyses and inform your decisions, especially during migration, optimization, or rationalization projects.
Coming Soon: Audit for BW Objects and Repositories
A similar interface will soon be available for SAP BW repositories, focusing on BEx Queries and their InfoProviders.