Presentation
SAP Data Warehouse Cloud is available since the end of 2019. It is a SaaS application for building data warehouses with data processing functionalities and advanced semantic management. SAP DWC is based on SAP HANA and therefore benefits from In-Memory technology. This application succeeds in combining the process of data management with the openness to advanced analysis tools.
This data warehouse is designed for both business users and development teams.
For reporting, SAP Data Warehouse Cloud relies on SAP Analytics Cloud, offering the possibility of a complete data warehouse in the cloud including modelling, consumption, data transformation and visualisation.
The different layers
Data Builder
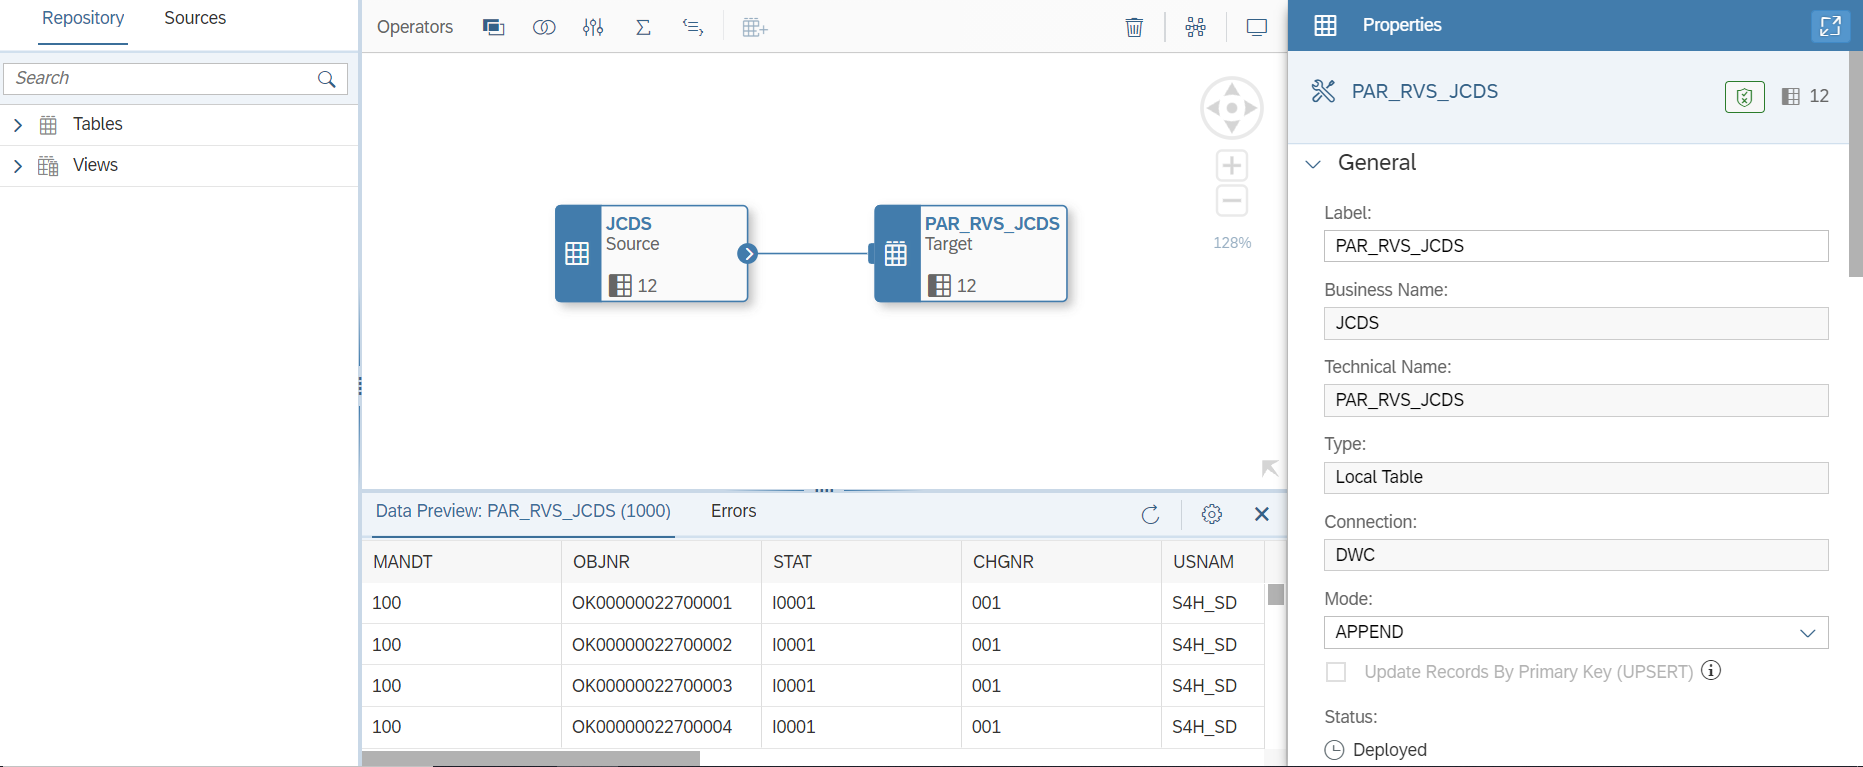
The data modelling layer allows us to retrieve data from our system using the Data Flow Graph. Various operations on the data are already possible at this stage.
In addition, we find common panes in all SAP DWC, on the left, a panel for consulting existing tables or tables available via our connections. In the centre, we have the graphical part which allows us to model our models thanks to Drag And Drop actions.
Below this part, we have a Data Preview that will allow us to check the consistency of our data throughout the process. On the last panel on the right, we have access to the metadata: technical name, business name, description of the view, distribution between attributes and measures, last update date, deployment status.
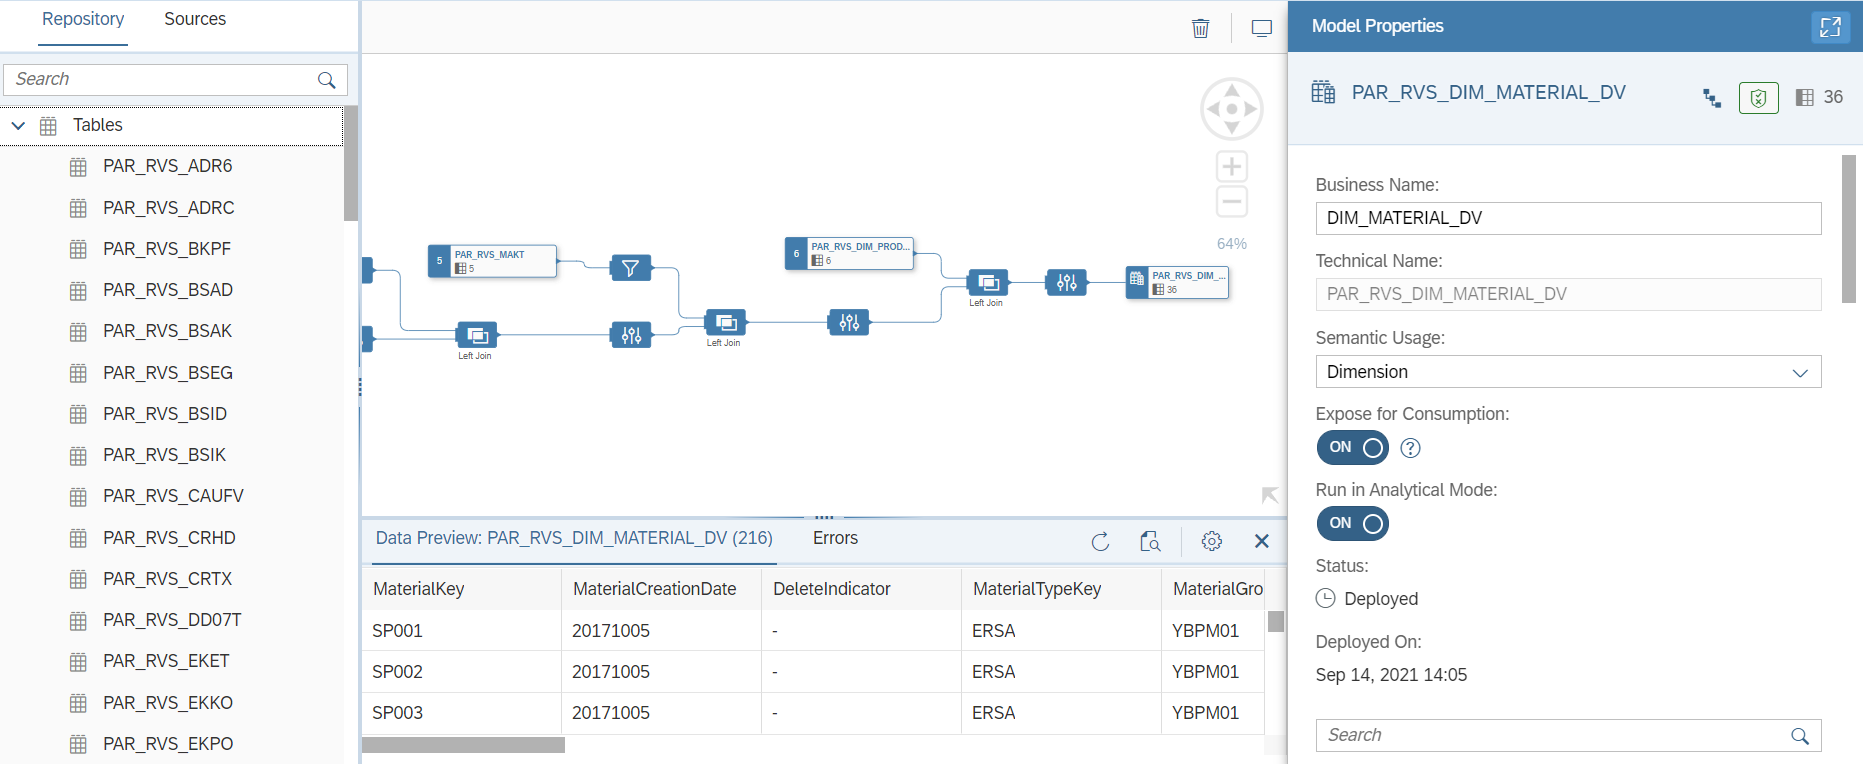
We can also create views in the Data Builder. These views are broken down into different types. We have the possibility of creating dimensions, factual views and finally “Analytical Datasets” which are the representation of our datamarts and which we use in our reporting tools.
In the creation of views, we use previously created tables or tables available directly via our connections. We apply modifications and transformations such as aggregations, filters, calculated columns or projections.
We can also apply joins or unions between our different tables. In addition to creating graphical views, we have the possibility to create SQL script views.
Subscribe to the Rapid Views Newsletter !
Stay up to date with our latest blog posts, upcoming webinars and news!
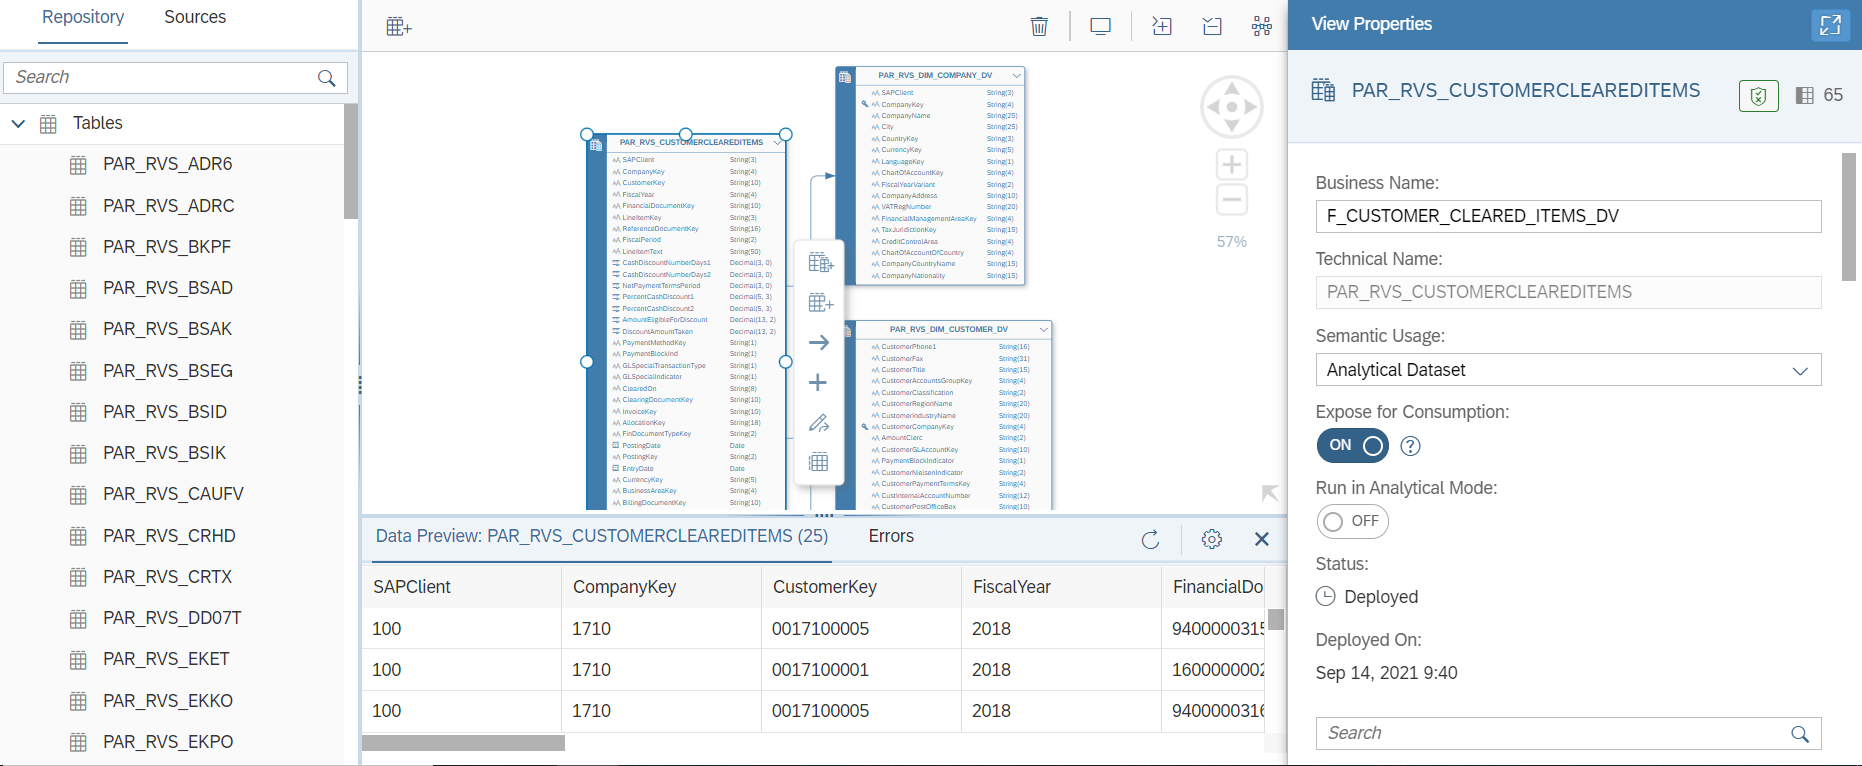
The E/R Model is the last view that can be created using the Data Builder. The purpose of this view is to fill in the joins between the factual view and the dimensions and to have a visual aspect on them in addition to being able to consult the available semantic layer. We can quickly see which dimension is attached to this factual view in order to create our datamart.
Business Builder
The Business Builder has a data advisory purpose and will be aimed at end users.
We need to recreate the tables in the Business Layer by indicating which table in the Data Builder we want to retrieve our data for the dimension.
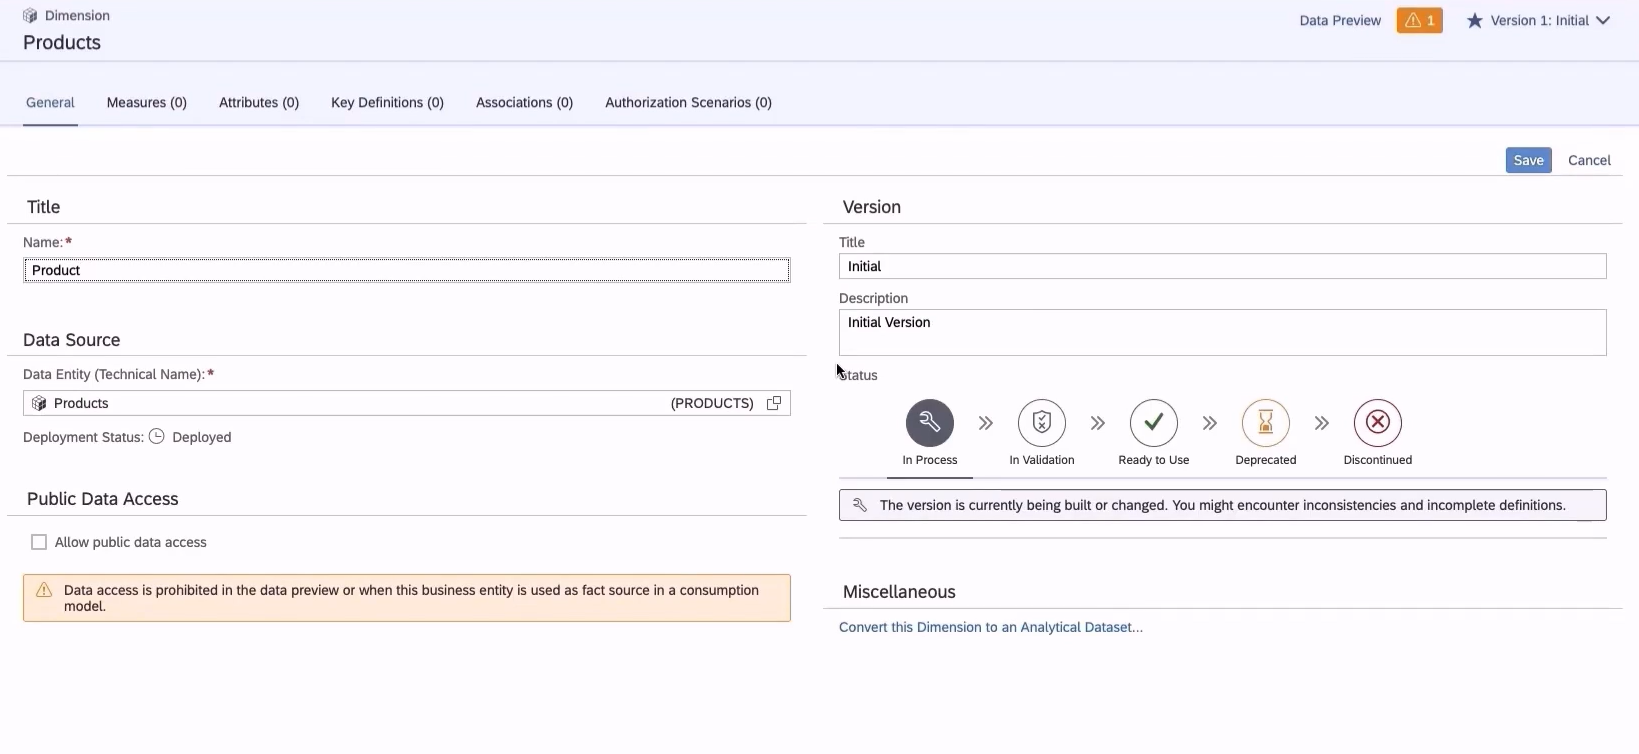
Different information about our dimension can be entered here in addition to the versioning that is available in the Business Builder. Different sub-menus “Attributes“, “Measures” and “Key Definition” allow us to fill in our data by assigning it to the functions of each. When creating a datamart in the Business Builder, we need to create our associations between our factual views and the dimensions.
In order to be able to adapt to business needs, we can create calculated fields, and even measures in this part. We can also create contexts in order to avoid conflicts between our data and to allow analysis of the data.
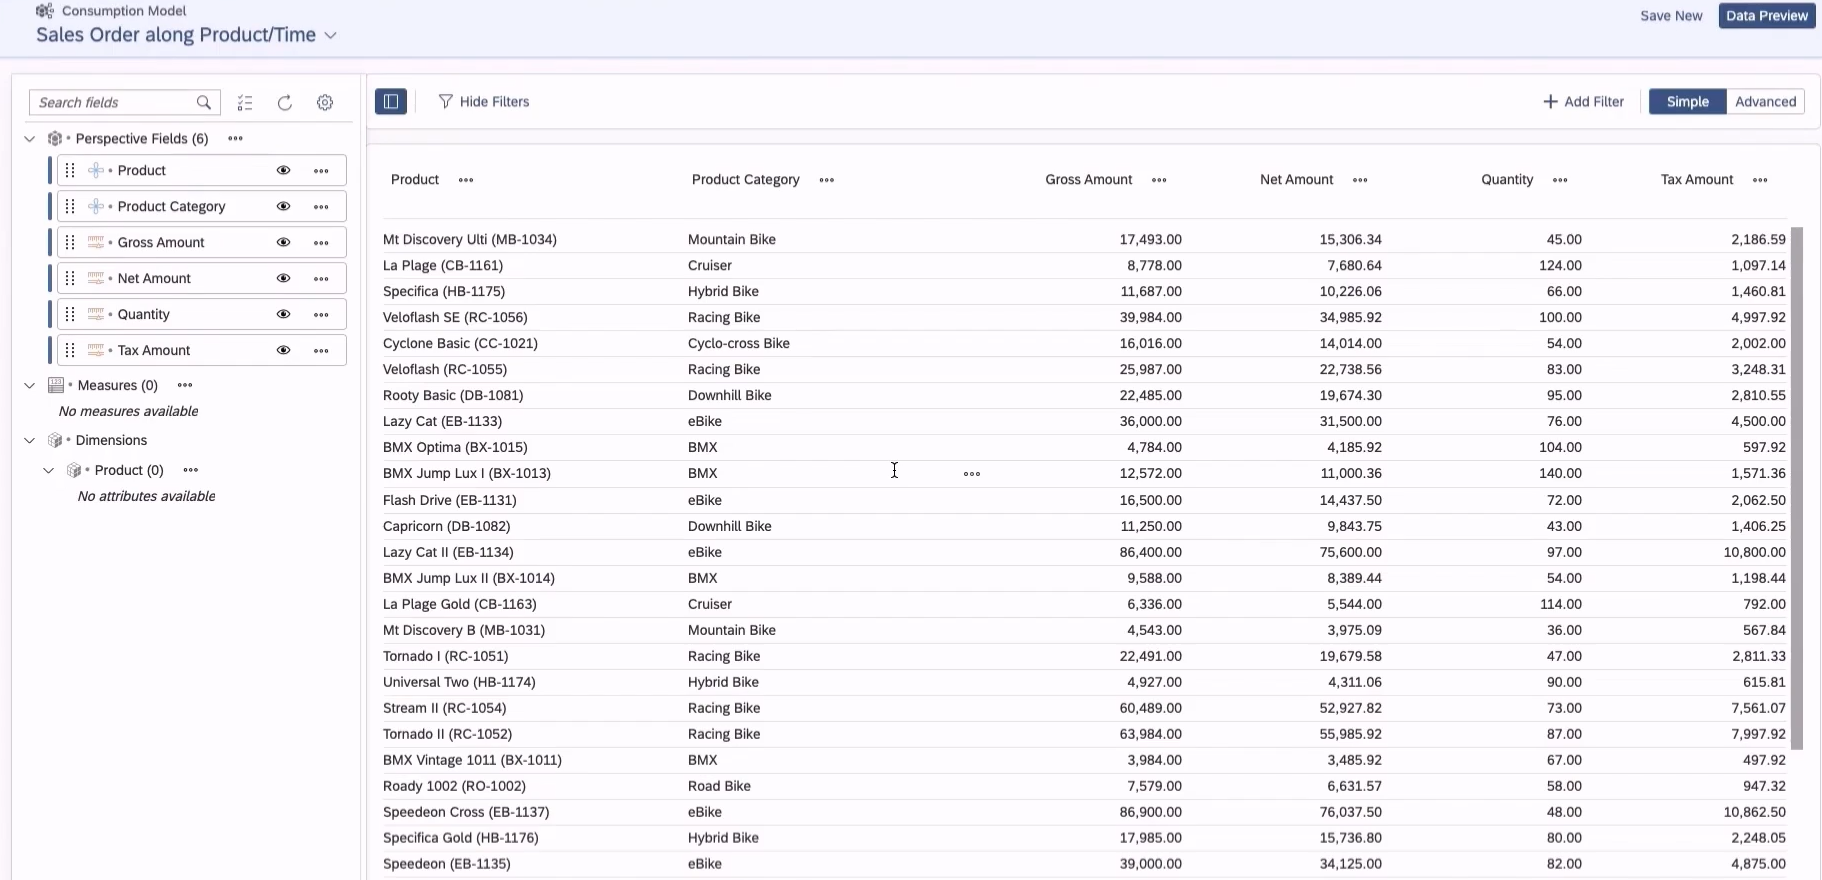
We can then create a Data Consumption so that we can access our data in a more readable way. The addition of our measures and attributes is again required and the addition of the previously created dimensions is required. The Data Preview section then allows us to navigate through our data to analyse it.
Connectors
For data import, we have 27 connectors for SAP and non-SAP databases at our disposal, so here are some examples:
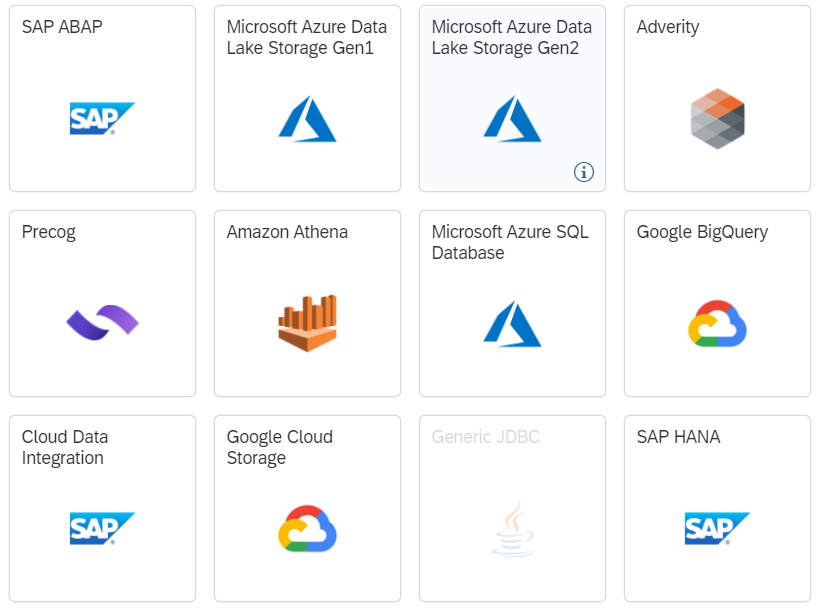
These connectors allow us to access our data very easily without having to configure additional tools. However, if our SAP database does not appear in the list of connectors, we can always configure the SAP Data Provising Agent to act as a connector between our database and SAP DWC.
Reporting
The reporting part is the final result that will be made available to customers. We will then find on these tools all the semantic layer which will have been set up in SAP DWC. We will be able to use the attributes of our dimensions thanks to our previously created joins.
We can use the attributes of our dimensions thanks to the joins we created earlier, so we have a range of simple or cross tables and graphs at our disposal. We can apply filters and sorting to these visuals.
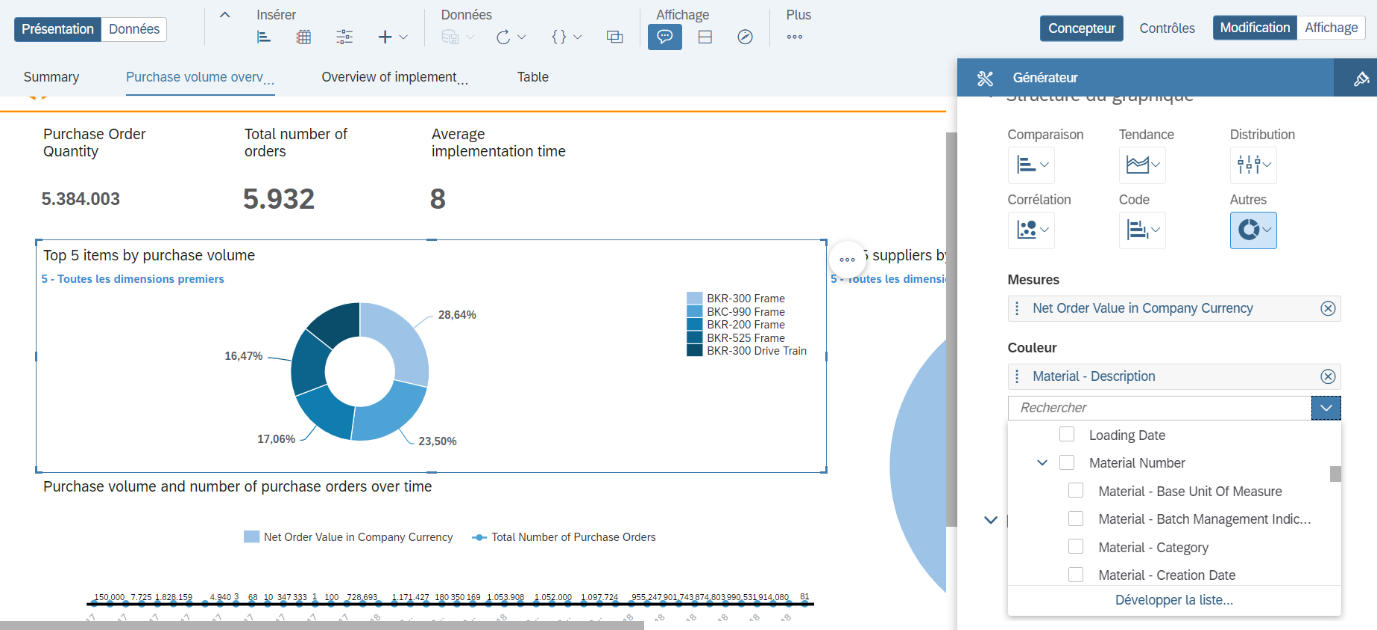
The reporting part can be done on the SAP Analytics Cloud tool which has a direct connector with SAP DWC. However, the use of other tools remains possible via ODBC, which makes SAP DWC compatible with Microsoft Power BI or Tableau Software for example.
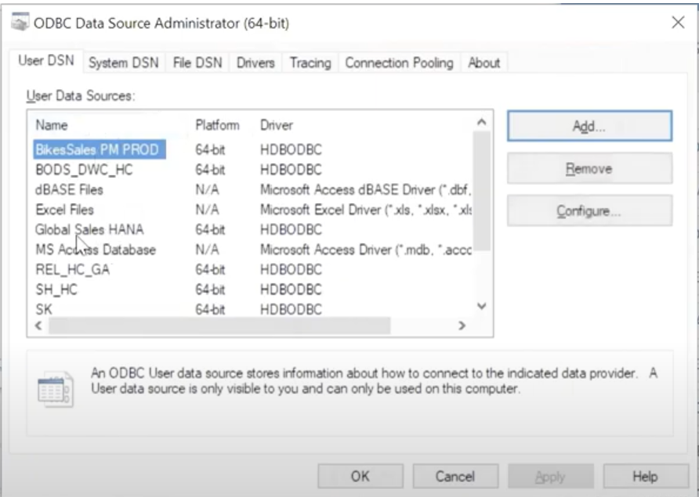
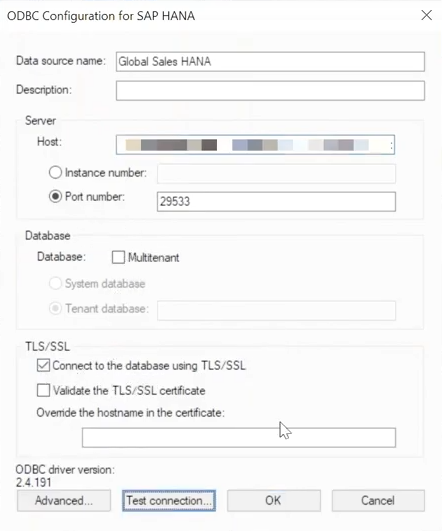
To create an ODBC connection, use ODBC Configuration for SAP HANA and specify the Host of the SAP DWC space and the port number. Afterwards, on the reporting tool, it is sufficient to select the ODBC connection we have just created. An identification is necessary with the SAP DWC identifiers. We will then have access to the data where the “Allow Consumption” option, present in the view properties, has been checked.
Conclusion
This new SAP Data Warehouse Cloud application allows us to perform complex tasks from any workstation. Mobility is a strength of this application. In addition, the speed and ease of use of the tool allows us to access results in record time.
SAP is permissive towards third-party tools with many connectors, which allows SAP Data Warehouse Cloud to have an even more open customer base.