Introduction
The RapidViews solutions aim to offer a real accelerator for the deployment of your SAP HANA BI projects, but also to manage and maintain them. RapidViews are composed of virtual datamarts or data counters, predefined reports and fact/dimension tables (HANA Views), which are the foundation of the solution. They are available on the SAP FI-CO, SD, MM, PP and QM ERP modules.
We estimate that the RapidViews solution covers on average 70% of the customer’s BI needs once installed. To cover the remaining 30% of needs and thus satisfy all the additional requests of the customers, we propose to accompany them in the realization of the developments.
To do this, we use a method that is broken down into several stages :
- In the first instance we work directly with the client to understand their needs. This step leads to the generation of technical specifications through a tool included in the RapidViews.
- At the same time, thanks to the same tool, we determine the list of requests that are already covered by the RapidViews and those that will need to be added to the model.
- Finally, once the developments in HANA Studio have been completed, and the reporting has been completed, we proceed with the acceptance of the data.
Use Case :
Creation of the F_ORDER_OPERATIONS_DV view
The RapidViews F_ORDER_OPERATIONS_DV is a factual view that meets a reporting need that is very much in demand by production business managers. The aim is to evaluate the performance indicators of each launched production operation linked to a launched production order.
Therefore, it was essential to build a factual view that contains both operation data and production order data in detail.
F_ORDER_OPERATIONS_DV view presentation
Subscribe to the Rapid Views Newsletter !
Stay up to date with our latest blog posts, upcoming webinars and news!
Summary of HANA developments
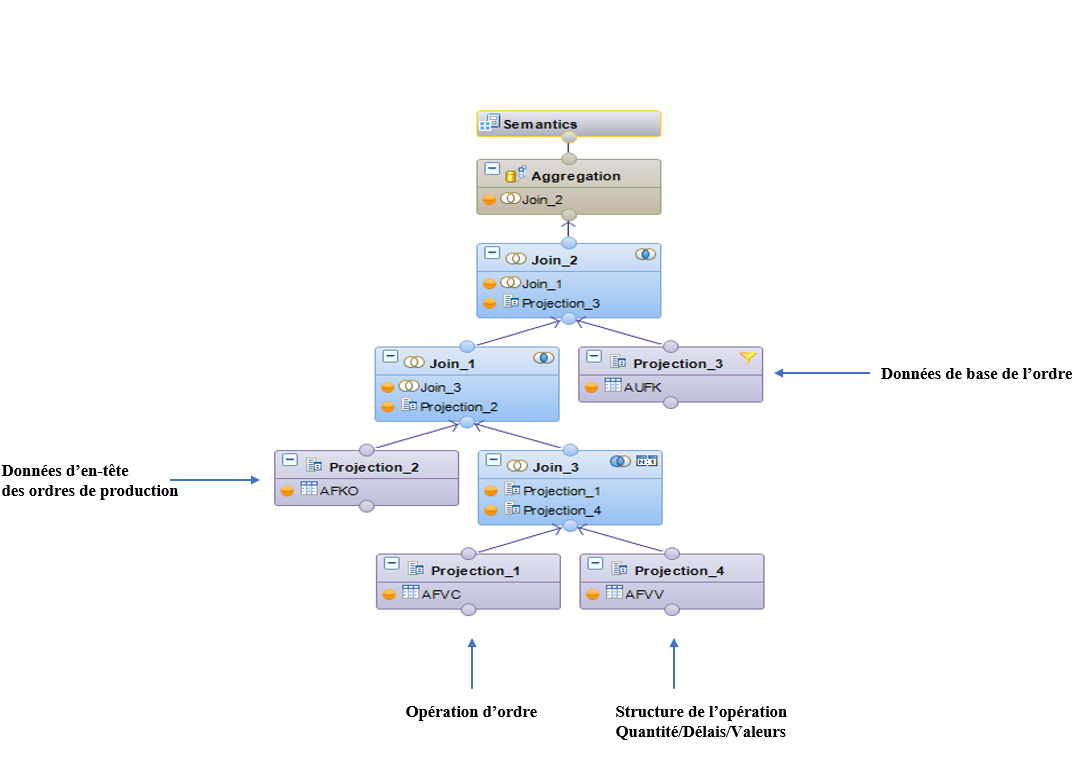
Join_3 : This join between the two tables AFVC and AFVV aims to retrieve the quantities, dates and values of each production operation.
- The AFVC table stores all operations related to production orders and all associated data.
- The AFVV table stores the expected (theoretical) and realised (actual) values of each activity in an operation. These indicators will be used later to calculate the time differences of the different activities.
Join_1 : This join between Join_3 and the AFKO table, which stores the headers of production orders, is intended to retrieve the item number linked to the production orders.
Join_2 : The purpose of this join between Join_1 and AUFK is to retrieve the general information of the production order such as the controlling area, the order category, the deletion flag….
- The AUFK table stores the basic data for production orders. In order to limit the data returned by this table, we use filters on the deletion flag and on the order category.
(in (“AUTYP”,’10’,’40’)) AND (“LOEKZ” !=‘X‘)
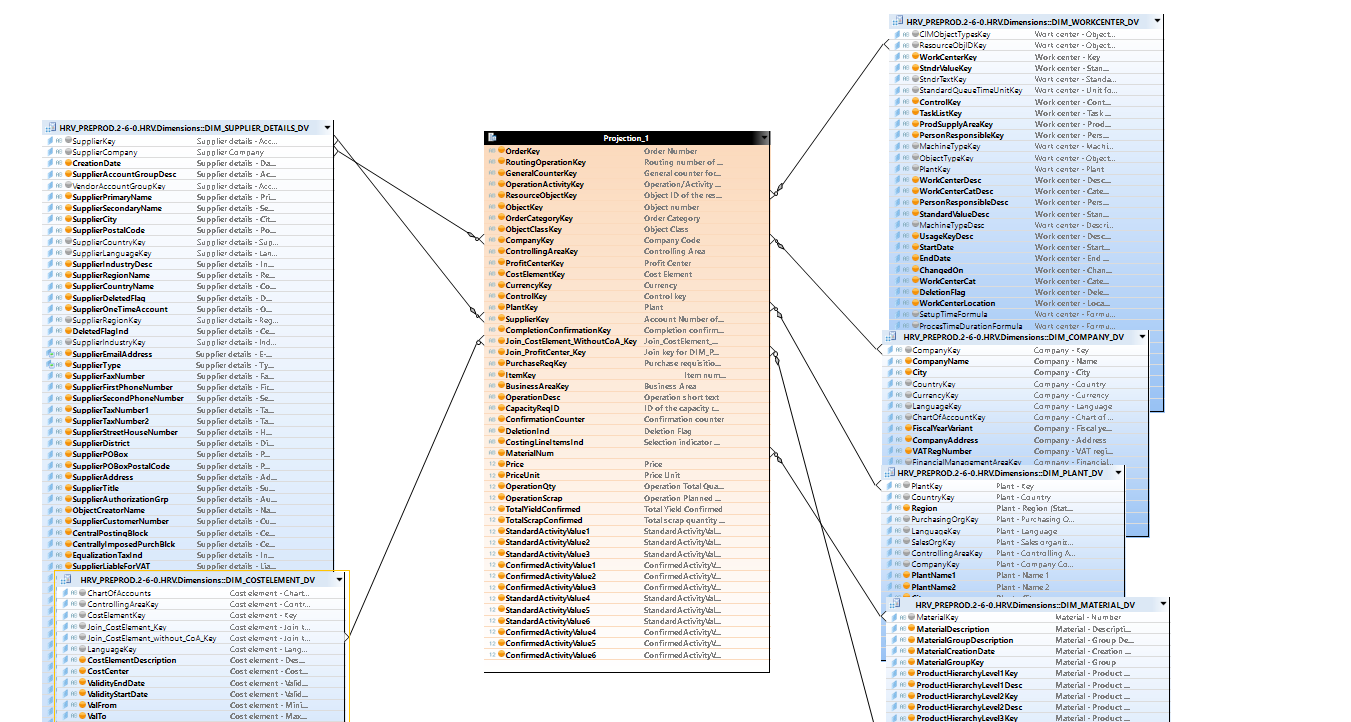
We can now use this view in a datamart, in order to join the multiple dimensions necessary for the analysis of the different indicators linked to the performance of the production operations and for the realization of the reports (Supplier, Profit Centre, Cost Centre, materials, plant, …)
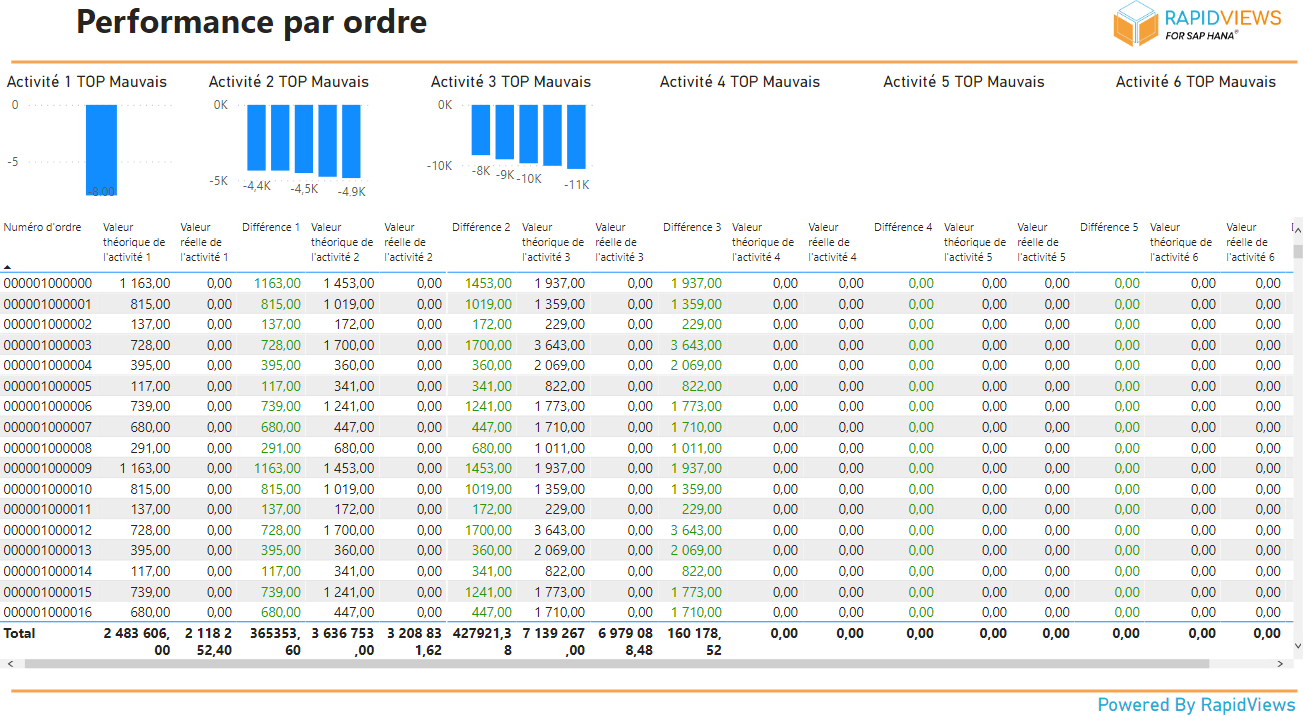
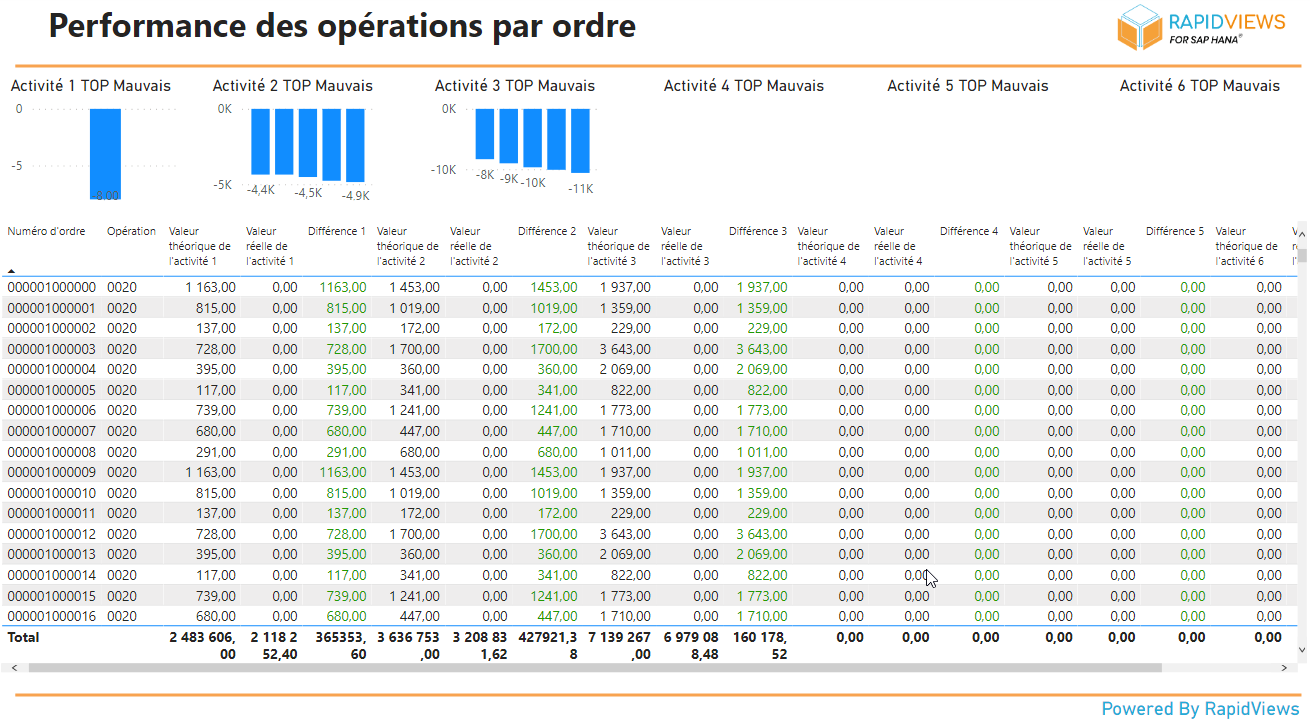
Reporting
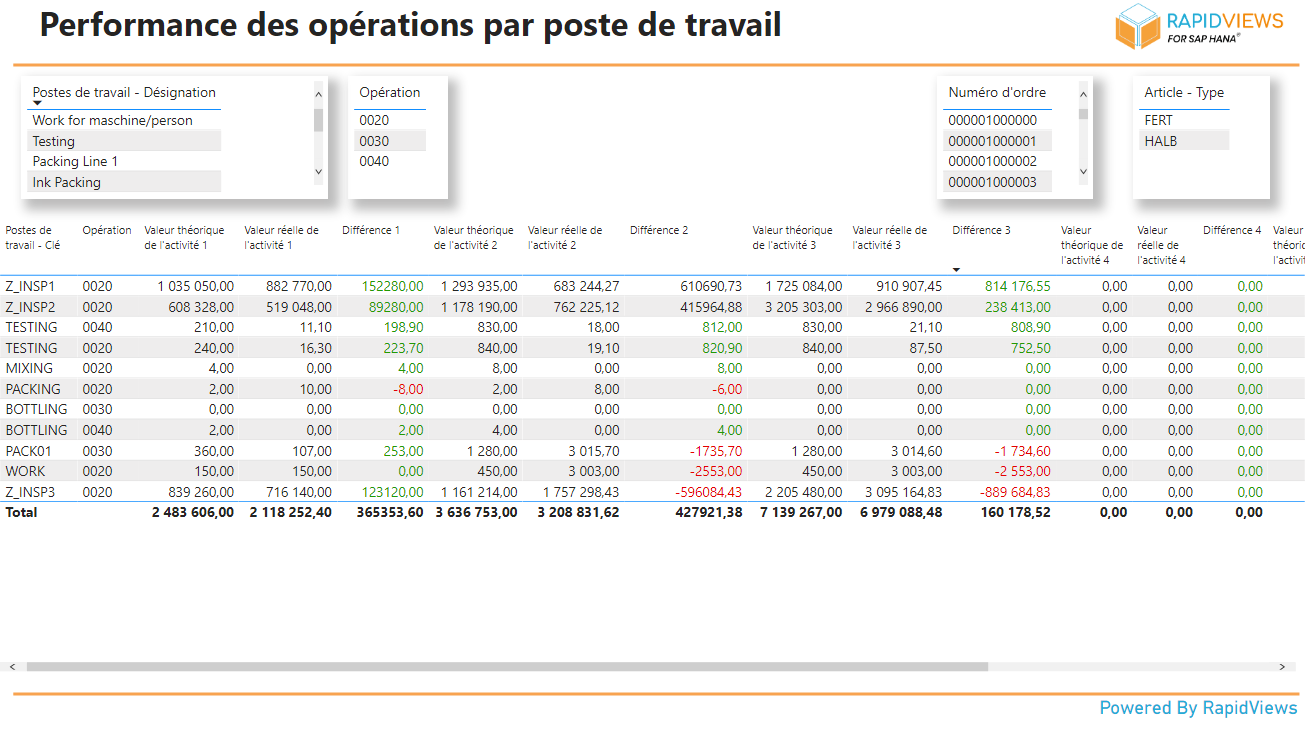
Conclusion
The “F_ORDER_OPERATIONS_DV” view is a view created to meet the need to calculate the different performances (man/machine) that concern the operations of the launched production orders.
This view shows how RapidViews can be used to meet different business needs.
In this use case, we have used standard SAP tables. Additional developments can vary according to customer needs such as adding specific SAP tables (e.g. Z_ tables) and customer specific business rules, calculating new indicators, …