


What is a Data Catalog? The Essential GPS for Your Data
Have you ever heard these phrases within your company? “Does anyone know where to find this KPI?” or “This report already exists, but it’s impossible to find…”
In many organizations, data is everywhere: in SAP, Power BI, SAP Analytics Cloud, Tableau, Qlik, Excel… Reports are multiplying, metrics are expanding, and finding the right information sometimes becomes more complicated than producing it. It is precisely to address this challenge that the Data Catalog emerged.
Why is everyone talking about Data Catalogs?
Companies today produce an overwhelming amount of data. Yet paradoxically, the more data there is, the harder it becomes to answer simple questions:
Where can I find this information?
Which report uses this indicator?
Is this data trustworthy?
Does a similar dashboard already exist?
Who owns this KPI?
Without a structured organization, everyone ends up recreating their own reports—often resulting in multiple versions of the exact same metric. This leads to duplicates, wasted time, misinterpretations, and a decline in overall confidence in the data.
What exactly is a Data Catalog?
A Data Catalog can be compared to a library’s catalog. In a library, the books already exist. The catalog doesn’t create the books; it simply points out where they are, what they talk about, who wrote them, and who they are intended for.
For data, the principle is exactly the same. A Data Catalog references the company’s data assets:
Reports,
Dashboards,
Datasets,
KPIs,
Columns,
Analytics objects,
Documentation.
It allows users to quickly identify:
Where a piece of information is located;
How it is calculated;
Who uses it;
The context in which it is utilized.
In other words, it transforms a scattered data landscape into a structured, easily accessible repository.
Why a Data Catalog is becoming essential
Let’s take an example. A company uses SAP BW, SAP Datasphere, SAP Analytics Cloud, Power BI, and a few legacy Excel reports. After several years, it finds itself with hundreds of reports, thousands of KPIs, dozens of BI developers, and multiple business teams.
When a user searches for revenue figures, they might get different results depending on the report they open. The problem is not the data itself; the problem is knowing which data to use.
This is exactly where a Data Catalog provides clarity and visibility.
A Data Catalog does not replace your BI tools
This is a common misconception. A Data Catalog does not replace SAP BW, SAP Datasphere, Power BI, SAP Analytics Cloud, Tableau, or Qlik. Instead, it complements them. Its purpose is to deliver a cross-functional overview of your entire Analytics portfolio, regardless of the technology used. It serves as the single entry point to search, document, and extract value from company data.
BI Smart Repository: A Data Catalog tailored for Analytics environments
At RapidViews, we designed the BI Smart Repository to solve a challenge faced by many organizations: how to easily locate BI developments, document your Analytics assets, and improve data governance without multiplying scattered Excel files and documentation. The BI Smart Repository acts as a truly centralized hub for all your Analytics content.
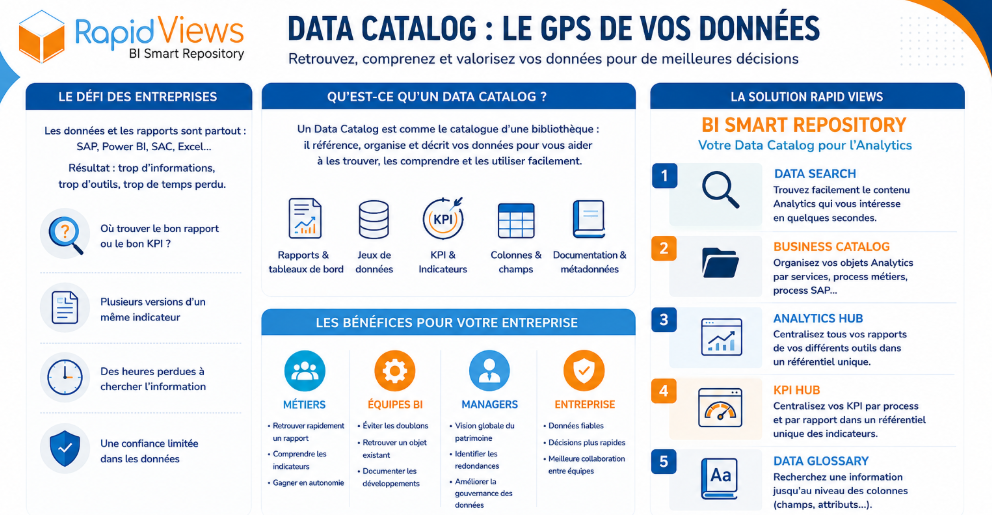
1. Instantly find your Analytics objects

How much time do you waste searching for a report, a query, or a specific technical object? The Data Search feature enables BI developers, Analytics managers, and business teams to find the content they need in seconds. No more endless searching through various tools or folders—a simple query grants immediate access to the relevant information.
2. Organize your Analytics assets by business logic

Every company has its own unique structure. With the Business Catalog, you can organize your Analytics objects according to your own logic:
Business departments;
Business processes;
SAP processes;
Functional domains;
Or any other taxonomy that fits your organization.
Your corporate data landscape finally becomes legible and easy to navigate.
3. Centralize all your reports

Today, it is common for a company to use multiple reporting tools simultaneously. Power BI, SAP Analytics Cloud, SAP BW, Tableau, Qlik… Reports are often scattered. The Analytics Hub within the BI Smart Repository lets you centralize all this content into a single repository. You get a global view of your entire Analytics footprint, independent of the underlying technologies.
4. Centralize your KPIs

A single metric can be used across several different reports. But where is it officially defined? What is its formula? The KPI Hub centralizes all company indicators. Each KPI can be thoroughly documented, linked to the reports using it, and organized by business process. This streamlines data governance and restores trust in the figures used daily.
5. Track down information to the column level

Search doesn’t stop at the report level. With the Data Glossary, users can search for information directly within the columns, fields, or attributes of datasets. This feature perfectly complements Data Search by providing a deep level of detail that is particularly valuable for BI developers, Data teams, and data governance managers.
In Summary
Organizations are investing heavily in their Analytics platforms. However, the true value does not lie solely in producing new reports. It also lies in the ability to locate, understand, share, and reuse existing data. This is precisely the role of a Data Catalog.
With BI Smart Repository, RapidViews delivers a solution that goes far beyond a simple technical inventory. It centralizes reports, documents KPIs, structures Analytics objects, accelerates search, and elevates the governance of your entire decision-making landscape.
Whether you run SAP BW, BW/4HANA, SAP Datasphere, SAP Analytics Cloud, Power BI, or a mix of multiple tools, having a single source of reference is a powerful performance driver for both your BI teams and business users.