Introduction
The RapidViews solutions aim to offer a real accelerator for the deployment of your SAP HANA BI projects, but also to manage and maintain them. RapidViews are composed of virtual datamarts or data counters, predefined reports and fact/dimension tables (HANA Views), which are the foundation of the solution. They are available on the SAP FI-CO, SD, MM and PP ERP modules.
We estimate that the RapidViews solution covers on average 70% of the customer’s BI needs once installed. To cover the remaining 30% of needs and thus satisfy all the additional requests of the customers, we propose to accompany them in the realization of the developments.
To do this, we use a method that is broken down into several stages :
- In the first instance we work directly with the client to understand their needs. This step leads to the generation of technical specifications using a tool included in RapidViews.
- At the same time, using the same tool, we determine which requests are already covered by RapidViews and which ones will need to be added to the model.
- Finally, once the developments in HANA Studio and the reporting are completed, we proceed with the acceptance of the data.
Use Case - Creation of an additional view for the order book
To illustrate this method, we will present the work carried out for one of our clients in the context of a BI deployment on sales (SD module).
The client expressed the need to create operational “Order-to-Cash” (OTC or O2C) reports, i.e. containing all the data from the SD flow: order, delivery and invoicing.
Introducing RapidViews SD
Let’s start by introducing the RapidViews of the SD module.
There are 4 basic views :
- The sales documents view (F_SALES_ORDER_DV)
- The delivery view (F_DELIVERIES_DV)
- The invoices view (F_BILLING_DV)
- The delivery schedule view (F_SCHEDULE_LINES_DV)
These 4 main views are surrounded by other additional views :
- A view for calculating the sales OTIF (F_OTIF_DV), based on a join between the orders view and the deliveries view. This join allows us to calculate the OTIF, an indicator representing the ratio of deliveries delivered on time and in the required quantity.
- A view displaying the remaining deliveries (F_BACKLOG_DV).
- A view containing the SD document flow (F_SD_FLOW_DV)
Subscribe to the Rapid Views Newsletter !
Stay up to date with our latest blog posts, upcoming webinars and news!
Summary of specifications
We note that the RapidViews contain the views we need to meet the Order-to-Cash requirement. Indeed, the views of orders, deliveries and invoices have been installed at the customer’s premises on a turnkey basis.
We also note that these views are independent, yet the interest of an “Order-to-Cash” view is to bring together the data from the three views mentioned above in a single view, and to add indicator calculations and business rules specific to our client.
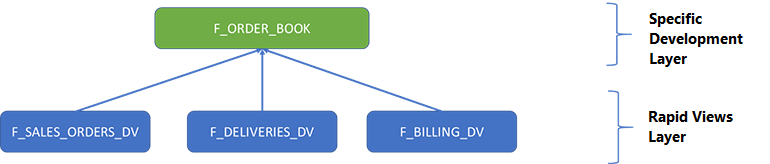
The objective of the additional developments is therefore to create an “Order-to-Cash” view that we will call F_ORDER_BOOK, which will perform the join between orders, deliveries and invoices, and which will include the business rules specific to our client.
The F_ORDER_BOOK view will be part of the layer of views above the RapidViews :
HANA developments
All SD views contain the Sales Document No. and Sales Document Item No. in their field list. The joins required in F_ORDER_BOOK are therefore possible using these two fields.
There is one small subtlety concerning the joins. We want the final view to have a mesh at order item level (one row per order item). As it is possible to find several delivery items for the same order item, there is a risk of duplicating the order items. To avoid this problem, we have to do some work before the join, which consists of filtering on one delivery item per order item.
Our customer’s rule in this case is: to keep the attributes of the most recent delivery per order item and to aggregate the indicators of all delivery items per order item.
In HANA development this results in the creation of two branches at the output of the projection 3 view of the deliveries (c.f. diagram below): one branch to classify the deliveries and filter them on the date of creation (Projection_6), and one branch to aggregate the indicators.
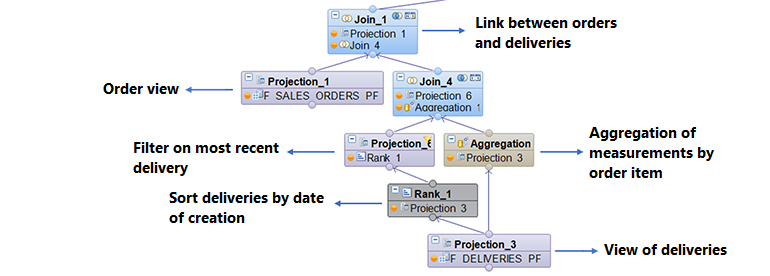
Extract from the Calculation Views HANA schema : F_ORDER_BOOK
We also encounter this type of case for invoices, so we developed an identical schema under the invoice join.
Here is the final version of the F_ORDER_BOOK view in the SAP HANA Studio:
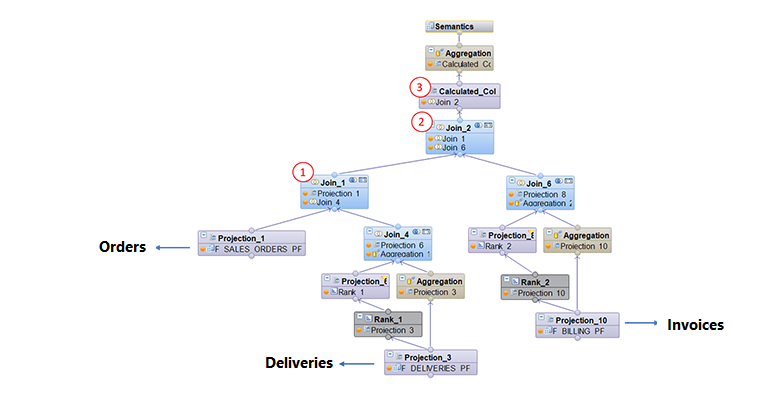
The main elements are the following :
- A join between orders and deliveries
- A join between orders and invoices
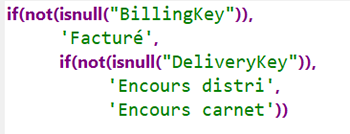
- Columns calculated within the last projection. Here are some examples of calculations:
- Status of the order item :
- Remaining quantities to be invoiced
- Expected delivery date
- ….
The HANA developments end with the creation of a datamart view which has the function of joining to our new Fact view (F_ORDER_BOOK), the multiple dimensions or analysis axes necessary for the creation of our report. The dimension views can also be subject to additional developments at the request of the client (additional hierarchies, client-specific business rules, etc.).
Reporting on Power BI
The HANA views built in the previous section are now usable on reporting tools such as Web Intelligence from SAP BusinessObjects, Analysis for Office, Power BI from Microsoft, Tableau Software, …
Below is an example of the dashboard : Order Book, built on Power BI
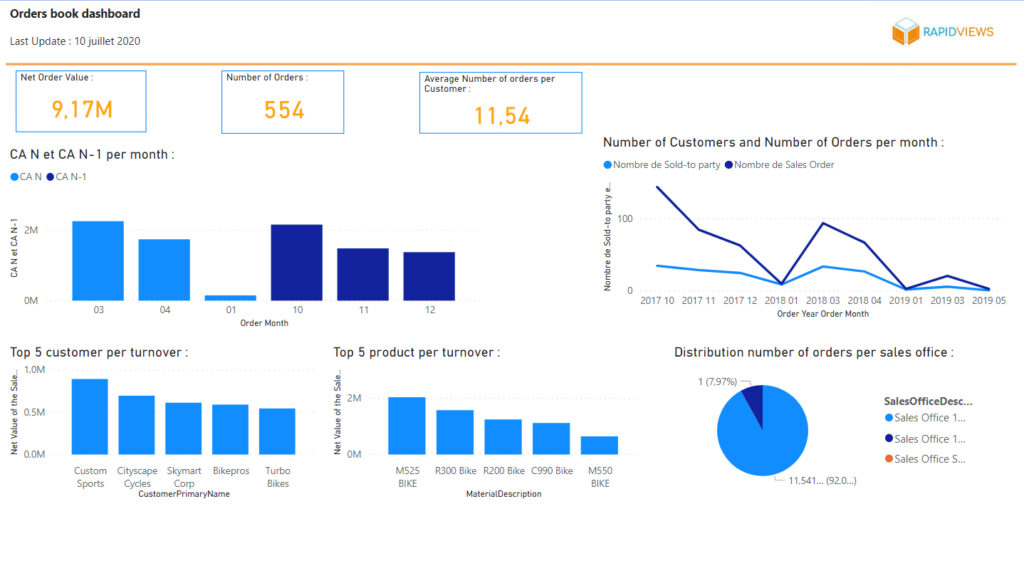
The left-hand side of the report shows the filters that can be used in this report: order year, sales organisation, customer and article.
The pie chart gives us the number of orders by status :
- Invoiced : order with a delivery ID and an invoice ID
- Outstanding distribution : order with a delivery ID only
- Outstanding backlog : order without a delivery ID and an invoice ID
The curve on the right-hand side of the report shows the evolution of the number of “Open” orders over time (Outstanding backlog and Outstanding distribution) according to the date the order was created.
The graph at the bottom left shows the customers for whom orders are in progress (sorted by number of orders).
The histogram at the bottom right allows you to compare the amounts ordered and the amounts invoiced.
Expert’s conclusion
The “Order-to-Cash” view that we have created is one of the most complete views of the SD module, as it brings together data from sales documents (contracts, orders, etc.), deliveries and invoices. It allows the deployment of global indicators on sales activity.
For example, within the same report, we can compare quantities ordered, delivered and invoiced, and we are able to drill down to order item level via drill down or drill up functions.
The additional developments are not always the same, some may ask us to add SAP tables in case the required tables are not present in the Standard RapidViews (e.g. Z_ tables…). Others may require us to add customer-specific business rules, new indicator calculations, …